
Sign In Start Free Trial
Account

Add to playlist

Create a Playlist

Modal Close icon
You need to login to use this feature.
  • Book Overview & Buying Learning Einstein Analytics
  • Table Of Contents Toc
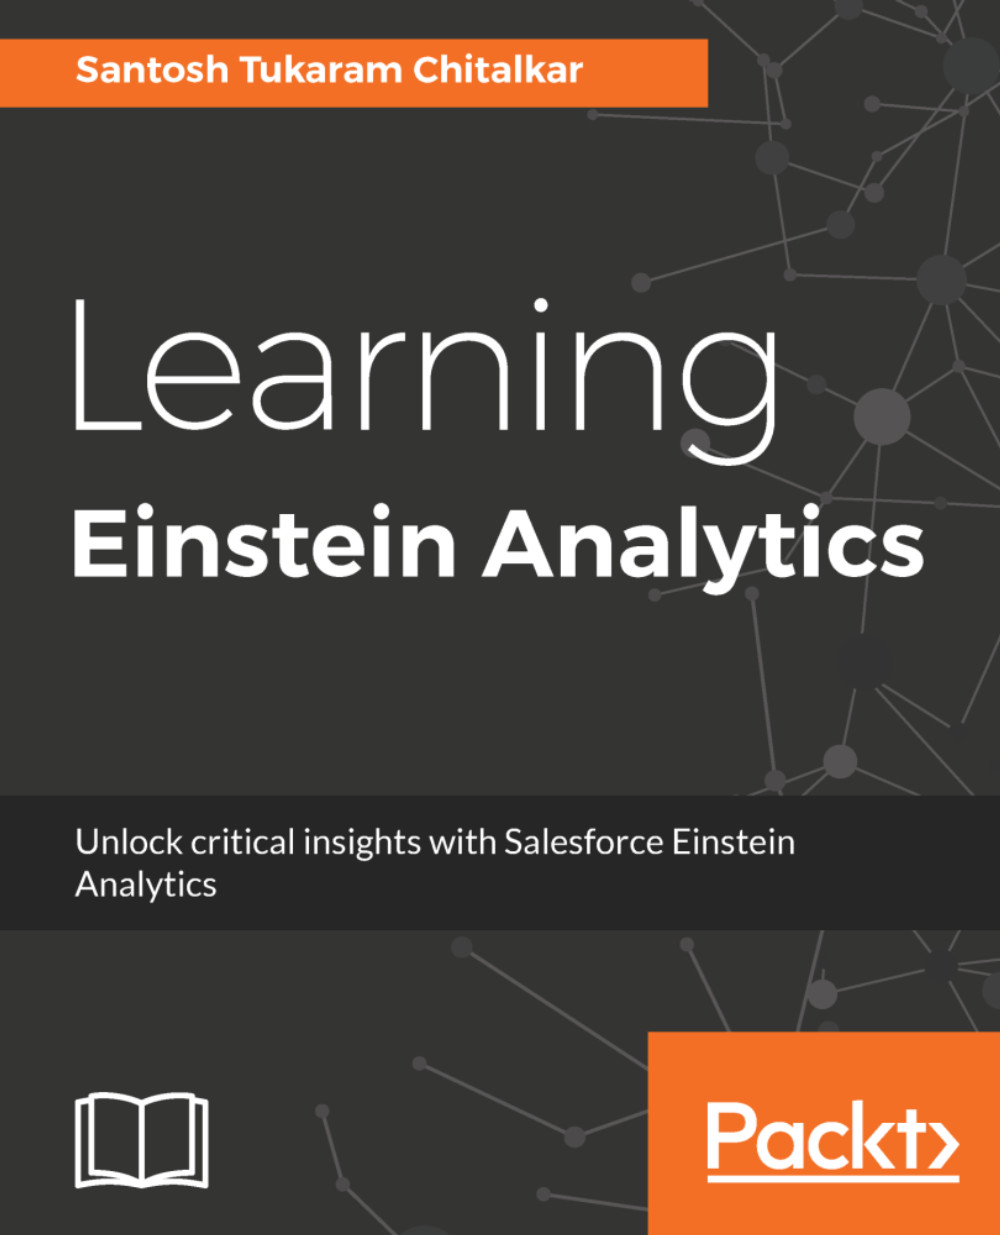
Learning Einstein Analytics

Learning Einstein Analytics

By : Santosh Tukaram Chitalkar
3.3 (3)
close
close
Learning Einstein Analytics

Learning Einstein Analytics

3.3 (3)
By: Santosh Tukaram Chitalkar

Overview of this book

Salesforce Einstein analytics aka Wave Analytics is a cloud-based platform which connects data from the multiple sources and explores it to uncover insights. It empowers sales reps, marketers, and analysts with the insights to make customer interactions smarter, without building mathematical models. You will learn to create app, lenses, dashboards and share dashboards with other users. This book starts off with explaining you fundamental concepts like lenses, step, measures and sets you up with Einstein Analytics platform. We then move on to creating an app and here you will learn to create datasets, dashboards and different ways to import data into Analytics. Moving on we look at Einstein for sales, services, and marketing individually. Here you will learn to manage your pipeline, understand important business drivers and visualize trends. You will also learn features related to data monitoring tools and embedding dashboards with lightning, visualforce page and mobile devices. Further, you will learn advanced features pertaining to recent advancements in Einstein which include machine learning constructs and getting predictions for events. By the end of this book, you will become proficient in the Einstein analytics, getting insights faster and understanding your customer in a better way.
Table of Contents (13 chapters)
close
close
7
Security and Sharing in Einstein Analytics

Summary

The idea of including this chapter was to give you an overview of the three advanced technologies Einstein Analytics has to build complex and customized dashboards and solutions. The user can use SAQL to retrieve data from the dataset and create advanced lenses. While using SAQL, the user can use different functions such as math functions, string functions, arithmetic functions, and so on. The XMD file can be configured to achieve the formatting of the dashboard, fields, and values. In order to change the formatting using XMD, we need to download the file, make the changes, and upload it again. While doing this, make sure that you have a backup of the original XMD.

Last but not least, Dashboard JSON. Dashboard JSON is used to build advanced dashboards. The Dashboard JSON file defines how the components on the dashboard should interact with each other. Using Dashboard JSON...

CONTINUE READING
83
Tech Concepts
36
Programming languages
73
Tech Tools
Icon Unlimited access to the largest independent learning library in tech of over 8,000 expert-authored tech books and videos.
Icon Innovative learning tools, including AI book assistants, code context explainers, and text-to-speech.
Icon 50+ new titles added per month and exclusive early access to books as they are being written.
Learning Einstein Analytics
notes
bookmark Notes and Bookmarks search Search in title playlist Add to playlist download Download options font-size Font size

Change the font size

margin-width Margin width

Change margin width

day-mode Day/Sepia/Night Modes

Change background colour

Close icon Search
Country selected

Close icon Your notes and bookmarks

Confirmation

Modal Close icon
claim successful

Buy this book with your credits?

Modal Close icon
Are you sure you want to buy this book with one of your credits?
Close
YES, BUY

Submit Your Feedback

Modal Close icon
Modal Close icon
Modal Close icon