Sign In Start Free Trial
Account

Add to playlist

Create a Playlist

Modal Close icon
You need to login to use this feature.
  • Book Overview & Buying Machine Learning Quick Reference
  • Table Of Contents Toc
Machine Learning Quick Reference

Machine Learning Quick Reference

By : Rahul Kumar
close
close
Machine Learning Quick Reference

Machine Learning Quick Reference

By: Rahul Kumar

Overview of this book

Machine learning makes it possible to learn about the unknowns and gain hidden insights into your datasets by mastering many tools and techniques. This book guides you to do just that in a very compact manner. After giving a quick overview of what machine learning is all about, Machine Learning Quick Reference jumps right into its core algorithms and demonstrates how they can be applied to real-world scenarios. From model evaluation to optimizing their performance, this book will introduce you to the best practices in machine learning. Furthermore, you will also look at the more advanced aspects such as training neural networks and work with different kinds of data, such as text, time-series, and sequential data. Advanced methods and techniques such as causal inference, deep Gaussian processes, and more are also covered. By the end of this book, you will be able to train fast, accurate machine learning models at your fingertips, which you can easily use as a point of reference.
Table of Contents (13 chapters)
close
close

Model evaluation

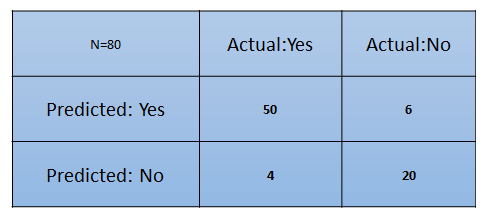
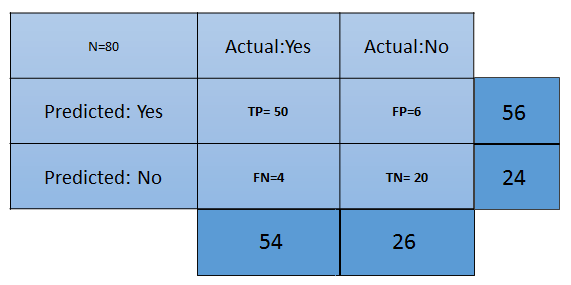
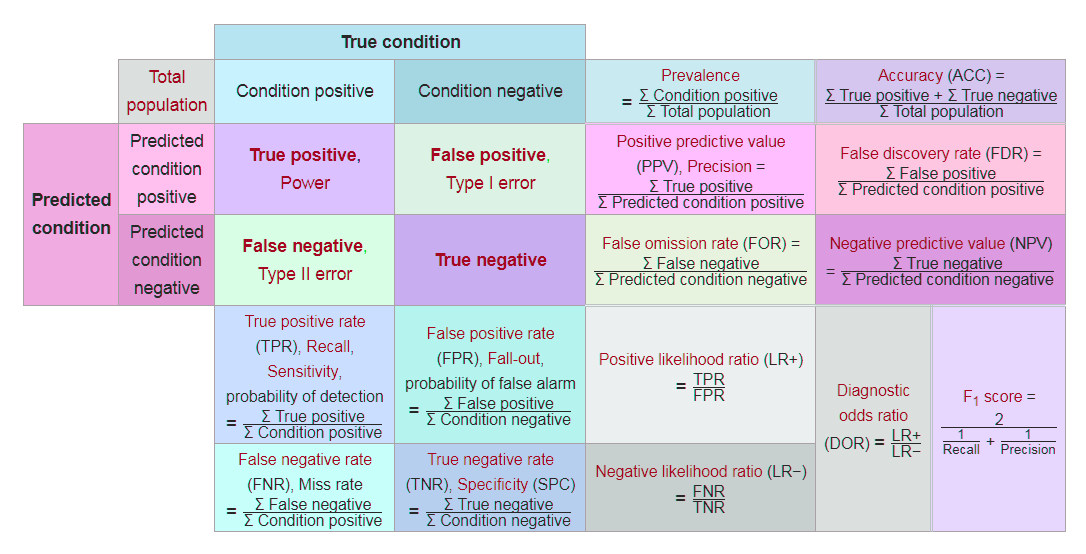
Let's look at some of the model evaluation techniques that are currently being used.

Confusion matrix

A confusion matrix is a table that helps in assessing how good the classification model is. It is used when true values/labels are known. Most beginners in the field of data science feel intimidated by the confusion matrix and think it looks more difficult to comprehend than it really is; let me tell you—it's pretty simple and easy.

Let's understand this by going through an example. Let's say that we have built a classification model that predicts whether a customer would like to buy a certain product or not. To do this, we need to assess the model on unseen data.

There are two classes:

  • Yes: The customer will buy the product
  • No: The customer will not buy the product

 From this, we have put the matrix together:

What are the inferences we can draw from the preceding matrix at first glance?

  • The classifier has made a total of 80 predictions. What this means is that 80 customers were tested in total to find out whether he/she will buy the product or not.
  • 54 customers bought the product and 26 didn't. 
  • The classifier predicts that 56 customers will buy the product and that 24 won't:

The different terms pertaining to the confusion matrix are as follows:

  • True Positive (TP): These are the cases in which we predicted that the customer will buy the product and they did.
  • True Negative (TN): These are the cases in which we predicted that the customer won't buy the product and they didn't.
  • False Positive (FP): We predicted Yes the customer will buy the product, but they didn't. This is known as a Type 1 error.
  • False Negative (FN): We predicted No, but the customer bought the product. This is known as a Type 2 error.

Now, let's talk about a few metrics that are required for the assessment of a classification model:

  • Accuracy: This measures the overall accuracy of the classifier. To calculate this, we will use the following formula: (TP+TN)/Total cases. In the preceding scenario, the accuracy is (50+20)/80, which turns out to be 0.875. So, we can say that this classifier will predict correctly in 87.5% of scenarios.
  • Misclassification rate: This measures how often the classifier has got the results wrong. The formula (FP+FN)/Total cases will give the result. In the preceding scenario, the misclassification rate is (6+4)/80, which is 0.125. So, in 12.5% of cases, it won't produce correct results. It can also be calculated as (1- Accuracy).
  • TP rate: This is a measure of what the chances are that it would predict yes as the answer, and the answer actually is yes. The formula to calculate this is TP/(Actual:Yes). In this scenario, TPR = (50/54)= 0.92. It's also called Sensitivity or Recall.
  • FP rate: This is a measure of what the chances are that it would predict yes, when the actual answer is no. The formula to calculate this rate is FP/(Actual:No). For the preceding example, FPR = (6/26)= 0.23.
  • TN rate: This is a measure of what the chances are that it would predict no, when the answer is actually no. The formula to calculate this is TN/(Actual:No). In this scenario, TNR= (20/26)= 0.76. It can also be calculated using (1-FPR). It's also called Specificity
  • Precision: This is a measure of correctness of the prediction of yes out of all the yes predictions. It finds out how many times a prediction of yes was made correctly out of total yes predictions. The formula to calculate this is TP/(Predicted:Yes). Here, Precision = (50/56)=0.89.
  • Prevalence: This is a measure of how many yes were given out of the total sample. The formula is (Actual:Yes/ Total Sample). Here, this is 54/80 = 0.67.
  • Null error rate: This is a measure of how wrong the classifier would be if it predicted just the majority class. The formula is (Actual:No/Total Sample). Here, this is 26/80=0.325.
  • Cohen's Kappa valueThis is a measure of how well the classifier performed compared to how well it would have performed simply by chance. 
  • F-Score: This is a harmonic mean of recall and precision, that is, (2*Recall*Precision)/(Recall+Precision). It considers both Recall and Precision as important measures of a model's evaluation. The best value of the F-score is 1, wherein Recall and Precision are at their maximum. The worst value of the F-score is 0. The higher the score, the better the model is: 

CONTINUE READING
83
Tech Concepts
36
Programming languages
73
Tech Tools
Icon Unlimited access to the largest independent learning library in tech of over 8,000 expert-authored tech books and videos.
Icon Innovative learning tools, including AI book assistants, code context explainers, and text-to-speech.
Icon 50+ new titles added per month and exclusive early access to books as they are being written.
Machine Learning Quick Reference
notes
bookmark Notes and Bookmarks search Search in title playlist Add to playlist download Download options font-size Font size

Change the font size

margin-width Margin width

Change margin width

day-mode Day/Sepia/Night Modes

Change background colour

Close icon Search
Country selected

Close icon Your notes and bookmarks

Confirmation

Modal Close icon
claim successful

Buy this book with your credits?

Modal Close icon
Are you sure you want to buy this book with one of your credits?
Close
YES, BUY

Submit Your Feedback

Modal Close icon
Modal Close icon
Modal Close icon