
In this section, we are going to solve the famous Titanic survival prediction problem available on Kaggle (see https://www.kaggle.com/c/titanic/data). The task is to complete the analysis of what sorts of people are likely to survive using an ML algorithm.
Deep learning from a disaster – Titanic survival prediction
Problem description
Before diving into the coding, let's see a short description of the problem. This paragraph is directly quoted from the Kaggle Titanic survival prediction page:
"The sinking of the RMS Titanic is one of the most infamous shipwrecks in history. On April 15, 1912, during her maiden voyage, the Titanic sank after colliding with an iceberg, killing 1502 out of 2224 passengers and crew. This sensational tragedy shocked the international community and led to better safety regulations for ships. One of the reasons that the shipwreck led to such loss of life was that there were not enough lifeboats for the passengers and crew. Although there was some element of luck involved in surviving the sinking, some groups of people were more likely to survive than others, such as women, children, and the upper class. In this challenge, we ask you to complete the analysis of what sorts of people were likely to survive. In particular, we ask you to apply the tools of machine learning to predict which passengers survived the tragedy."
Now, before going even deeper, we need to know about the data of the passengers traveling on the Titanic during the disaster so that we can develop a predictive model that can be used for survival analysis. The dataset can be downloaded from https://github.com/rezacsedu/TitanicSurvivalPredictionDataset. There are two .csv files:
- The training set (train.csv): Can be used to build your ML models. This file also includes labels as the ground truth for each passenger for the training set.
- The test set (test.csv): Can be used to see how well your model performs on unseen data. However, for the test set, we do not provide the ground truth for each passenger.
In short, for each passenger in the test set, we have to use the trained model to predict whether they'll survive the sinking of the Titanic. Table 1 shows the metadata of the training set:
|
Variable |
Definition |
|
survival |
Two labels:
|
|
pclass |
This is a proxy for the Socioeconomic Status (SES) of a passenger and is categorized as upper, middle, and lower. In particular, 1 = 1st, 2 = 2nd, 3 = 3rd. |
|
sex |
Male or female. |
|
Age |
Age in years. |
|
sibsp |
This signifies family relations as follows:
|
|
parch |
In the dataset, family relations are defined as follows:
Some children traveled only with a nanny, therefore parch=0 for them. |
|
ticket |
Ticket number. |
|
fare |
Passenger ticket fare. |
|
cabin |
Cabin number. |
|
embarked |
Three ports:
|
Now the question would be: using this labeled data, can we draw some straightforward conclusions? Say that being a woman, being in first class, and being a child were all factors that could boost a passenger's chances of survival during this disaster.
To solve this problem, we can start from the basic MLP, which is one of the oldest deep learning algorithms. For this, we use the Spark-based MultilayerPerceptronClassifier. At this point, you might be wondering why I am talking about Spark since it is not a DL library. However, Spark has an MLP implementation, which would be enough to serve our objective.
Then from the next chapter, we'll gradually start using more robust DNN by using DeepLearning4J, a JVM-based framework for developing deep learning applications. So let's see how to configure our Spark environment.
Configuring the programming environment
I am assuming that Java is already installed on your machine and the JAVA_HOME is set too. Also, I'm assuming that your IDE has the Maven plugin installed. If so, then just create a Maven project and add the project properties as follows:
<properties>
        <project.build.sourceEncoding>UTF-8</project.build.sourceEncoding>
        <java.version>1.8</java.version>
        <jdk.version>1.8</jdk.version>
        <spark.version>2.3.0</spark.version>
</properties>
In the preceding tag, I specified Spark (that is, 2.3.0), but you can adjust it. Then add the following dependencies in the pom.xml file:
<dependencies>
        <dependency>
            <groupId>org.apache.spark</groupId>
            <artifactId>spark-core_2.11</artifactId>
            <version>${spark.version}</version>
        </dependency>
        <dependency>
            <groupId>org.apache.spark</groupId>
            <artifactId>spark-sql_2.11</artifactId>
            <version>${spark.version}</version>
        </dependency>
        <dependency>
            <groupId>org.apache.spark</groupId>
            <artifactId>spark-mllib_2.11</artifactId>
            <version>${spark.version}</version>
        </dependency>
        <dependency>
            <groupId>org.apache.spark</groupId>
            <artifactId>spark-graphx_2.11</artifactId>
            <version>${spark.version}</version>
        </dependency>
        <dependency>
            <groupId>org.apache.spark</groupId>
            <artifactId>spark-yarn_2.11</artifactId>
            <version>${spark.version}</version>
        </dependency>
        <dependency>
            <groupId>org.apache.spark</groupId>
            <artifactId>spark-network-shuffle_2.11</artifactId>
            <version>${spark.version}</version>
        </dependency>
        <dependency>
            <groupId>org.apache.spark</groupId>
            <artifactId>spark-streaming-flume_2.11</artifactId>
            <version>${spark.version}</version>
        </dependency>
        <dependency>
            <groupId>com.databricks</groupId>
            <artifactId>spark-csv_2.11</artifactId>
            <version>1.3.0</version>
        </dependency>
</dependencies>
Then if everything goes smoothly, all the JAR files will be downloaded in the project home as Maven dependencies. Alright! Then we can start writing the code.
Feature engineering and input dataset preparation
In this sub-section, we will see some basic feature engineering and dataset preparation that can be fed into the MLP classifier. So let's start by creating SparkSession, which is the gateway to access Spark:
SparkSession spark = SparkSession
                     .builder()
                     .master("local[*]")
                     .config("spark.sql.warehouse.dir", "/tmp/spark")
                     .appName("SurvivalPredictionMLP")
                     .getOrCreate();
Then let's read the training set and see a glimpse of it:
Dataset<Row> df = spark.sqlContext()
                .read()
                .format("com.databricks.spark.csv")
                .option("header", "true")
                .option("inferSchema", "true")
                .load("data/train.csv");
df.show();
A snapshot of the dataset can be seen as follows:
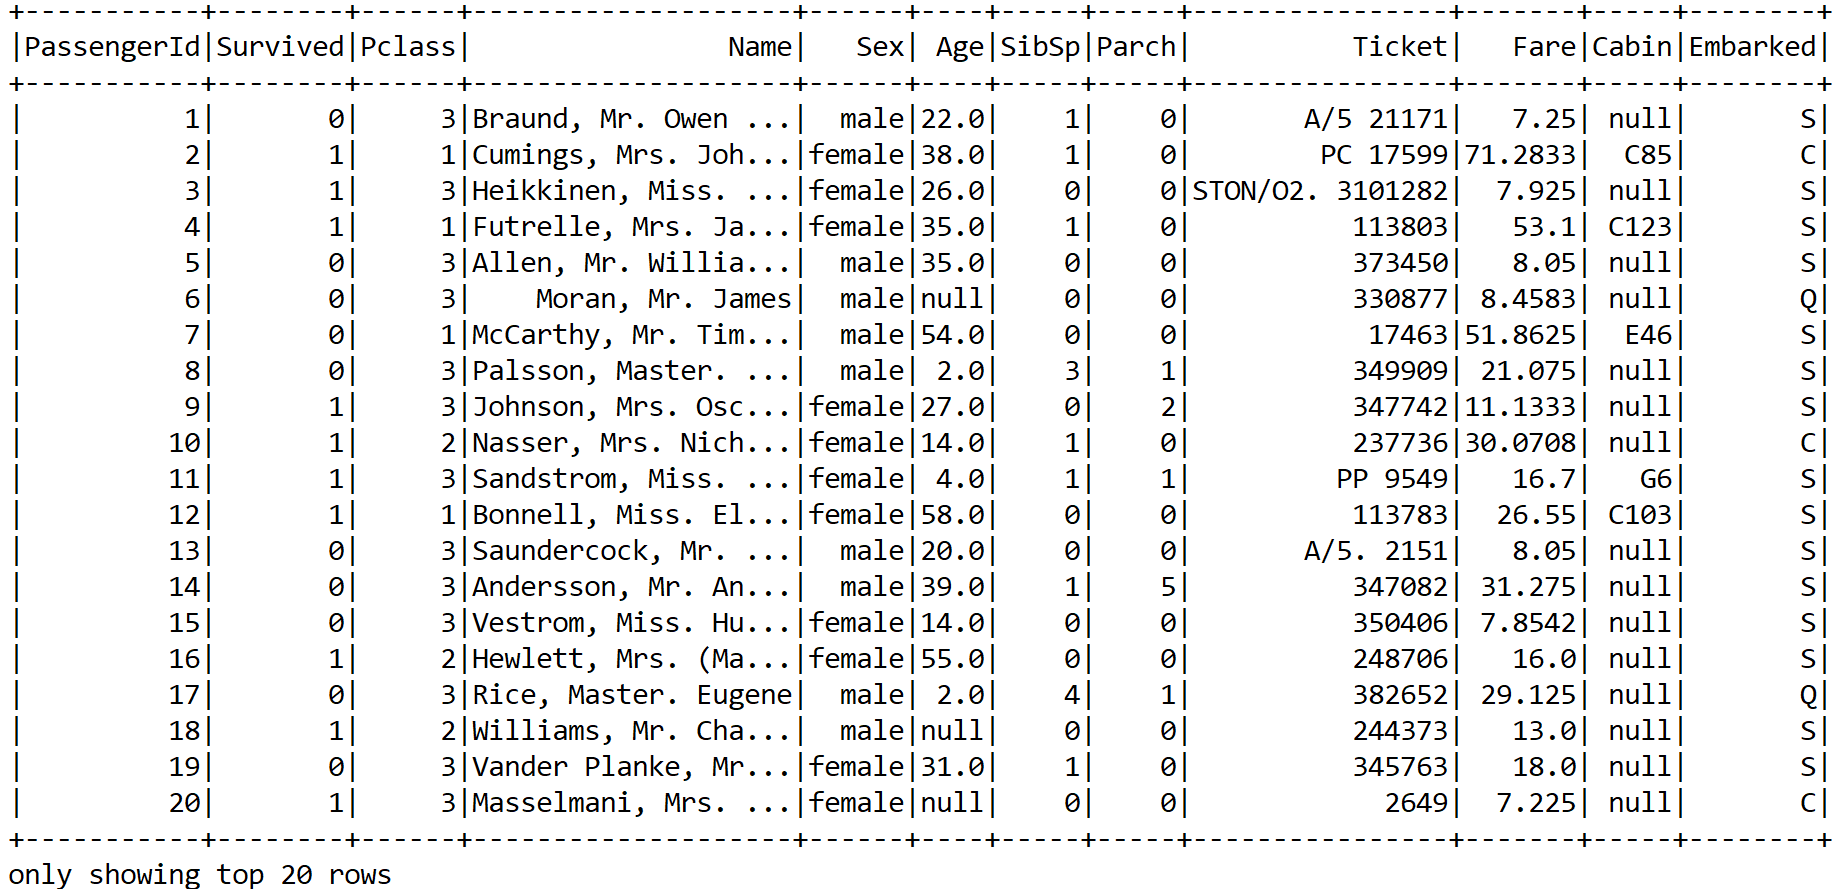
A snapshot of the Titanic survival dataset
Now we can see that the training set has both categorical as well as numerical features. In addition, some features are not important, such as PassengerID, Ticket, and so on. The same also applies to the Name feature unless we manually create some features based on the title. However, let's keep it simple. Nevertheless, some columns contain null values. Therefore, lots of consideration and cleaning are required.
I ignore the PassengerId, Name, and Ticket columns. Apart from these, the Sex column is categorical, so I've encoded the passengers based on male and female. Then the Embarked column is encoded too. We can encode S as 0, C as 1, and Q as 2.
For this also, we can write user-defined-functions (also known as UDFs) called normSex and normEmbarked for Sex and Embarked, respectively. Let's see their signatures:
private static UDF1<String,Option<Integer>> normEmbarked=(String d) -> {
        if (null == d)
            return Option.apply(null);
        else {
            if (d.equals("S"))
                return Some.apply(0);
            else if (d.equals("C"))
                return Some.apply(1);
            else
                return Some.apply(2);
        }
    };
Therefore, this UDF takes a String type and encodes as an integer. Now the normSex UDF also works similarly:
private static UDF1<String, Option<Integer>> normSex = (String d) -> {
      if (null == d)
          return Option.apply(null);
      else {
        if (d.equals("male"))
            return Some.apply(0);
        else
            return Some.apply(1);
      }
    };
So we can now select only useful columns but for the Sex and Embarked columns with the aforementioned UDFs:
Dataset<Row> projection = df.select(
                col("Survived"),
                col("Fare"),
                callUDF("normSex", col("Sex")).alias("Sex"),
                col("Age"),
                col("Pclass"),
                col("Parch"),
                col("SibSp"),
                 callUDF("normEmbarked",
                col("Embarked")).alias("Embarked"));
projectin.show();
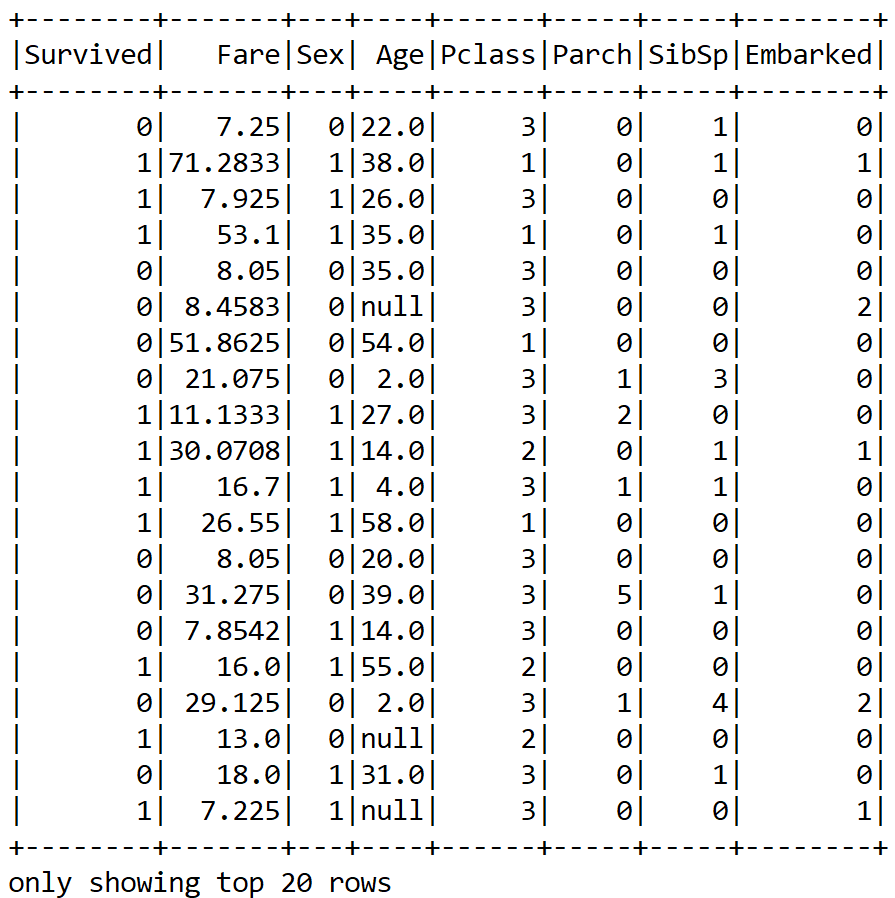
Now we have been able to convert a categorical column into a numeric; however, as we can see, there are still null values. Therefore, what can we do? We can either drop the null values altogether or apply some null imputing techniques with the mean value of those particular columns. I believe the second approach is better.
Now, again for this null imputation, we can write UDFs too. However, for that we need to know some statistics about those numerical columns. Unfortunately, we cannot perform the summary statistics on DataFrame. Therefore, we have to convert the DataFrame into JavaRDD<Vector>. Well, we also ignore the null entries for calculating this:
JavaRDD<Vector> statsDf =projection.rdd().toJavaRDD().map(row -> Vectors.dense( row.<Double>getAs("Fare"),
               row.isNullAt(3) ? 0d : row.Double>getAs("Age")
                  ));
Now let's compute the multivariate statistical summary. The summary statistical will be further used to calculate the meanAge and meanFare for the corresponding missing entries for these two features:
MultivariateStatisticalSummary summary = Statistics.colStats(statsRDD.rdd());
double meanFare = summary.mean().apply(0);
double meanAge = summary.mean().apply(1);
Now let's create two more UDFs for the null imputation on the Age and Fare columns:
UDF1<String, Option<Double>> normFare = (String d) -> {
            if (null == d) {
                return Some.apply(meanFare);
            }
            else
                return Some.apply(Double.parseDouble(d));
        };
Therefore, we have defined a UDF, which fills in the meanFare values if the data has no entry. Now let's create another UDF for the Age column:
UDF1<String, Option<Double>> normAge = (String d) -> {
          if (null == d)
              return Some.apply(meanAge);
          else
              return Some.apply(Double.parseDouble(d));
        };
Now we need to register the UDFs as follows:
spark.sqlContext().udf().register("normFare", normFare, DataTypes.DoubleType);
spark.sqlContext().udf().register("normAge", normAge, DataTypes.DoubleType);
Therefore, let's apply the preceding UDFs for null imputation:
Dataset<Row> finalDF = projection.select(
                col("Survived"),
                callUDF("normFare",
                col("Fare").cast("string")).alias("Fare"),
                col("Sex"),
                callUDF("normAge",
                col("Age").cast("string")).alias("Age"),
                col("Pclass"),
                col("Parch"),
                col("SibSp"),
                col("Embarked"));
finalDF.show();
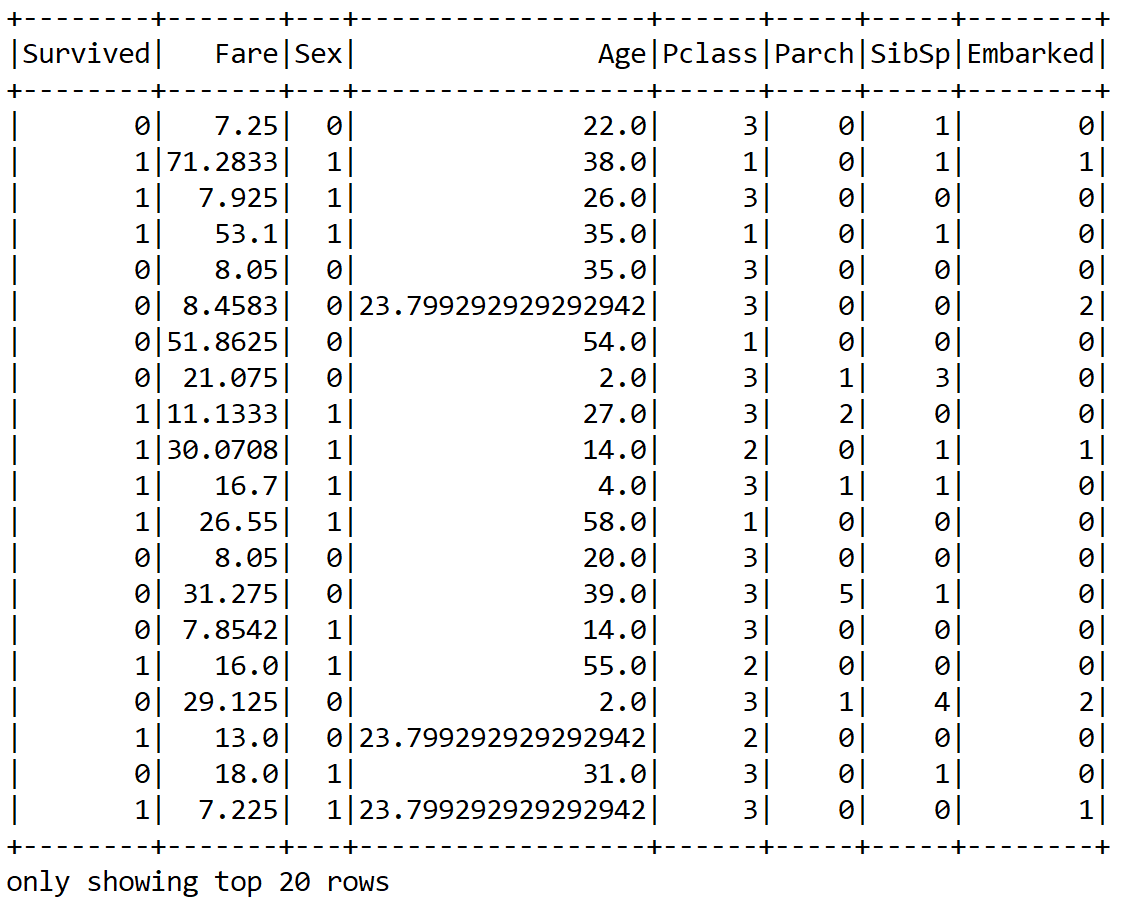
Great! We now can see that the null values are replaced with the mean value for the Age and Fare columns. However, still the numeric values are not scaled. Therefore, it would be a better idea to scale them. However, for that, we need to compute the mean and variance and then store them as a model to be used for later scaling:
Vector stddev = Vectors.dense(Math.sqrt(summary.variance().apply(0)), Math.sqrt(summary.variance().apply(1)));

Vector mean = Vectors.dense(summary.mean().apply(0), summary.mean().apply(1));
StandardScalerModel scaler = new StandardScalerModel(stddev, mean);
Then we need an encoder for the numeric values (that is, Integer; either BINARY or Double):
Encoder<Integer> integerEncoder = Encoders.INT();
Encoder<Double> doubleEncoder = Encoders.DOUBLE();
Encoders.BINARY();

Encoder<Vector> vectorEncoder = Encoders.kryo(Vector.class);
Encoders.tuple(integerEncoder, vectorEncoder);
Encoders.tuple(doubleEncoder, vectorEncoder);
Then we can create a VectorPair consisting of the label (that is, Survived) and the features. Here the encoding is, basically, creating a scaled feature vector:
JavaRDD<VectorPair> scaledRDD = trainingDF.toJavaRDD().map(row -> {
                VectorPair vectorPair = new VectorPair();
                vectorPair.setLable(new
                Double(row.<Integer> getAs("Survived")));

                vectorPair.setFeatures(Util.getScaledVector(
                                row.<Double>getAs("Fare"),
                                row.<Double>getAs("Age"),
                                row.<Integer>getAs("Pclass"),
                                row.<Integer>getAs("Sex"),
                                row.isNullAt(7) ? 0d :
                                row.<Integer>getAs("Embarked"),
                                scaler));
                return vectorPair;
        });
In the preceding code block, the getScaledVector() method does perform the scaling operation. The signature of this method can be seen as follows:
public static org.apache.spark.mllib.linalg.Vector getScaledVector(double fare,
        double age, double pclass,  double sex, double embarked, StandardScalerModel scaler) {
        org.apache.spark.mllib.linalg.Vector scaledContinous = scaler.transform(Vectors.dense(fare, age));
        Tuple3<Double, Double, Double> pclassFlat = flattenPclass(pclass);
        Tuple3<Double, Double, Double> embarkedFlat = flattenEmbarked(embarked);
        Tuple2<Double, Double> sexFlat = flattenSex(sex);

        return Vectors.dense(
                scaledContinous.apply(0),
                scaledContinous.apply(1),
                sexFlat._1(),
                sexFlat._2(),
                pclassFlat._1(),
                pclassFlat._2(),
                pclassFlat._3(),
                embarkedFlat._1(),
                embarkedFlat._2(),
                embarkedFlat._3());
    }
Since we planned to use a Spark ML-based classifier (that is, an MLP implementation), we need to convert this RDD of the vector to an ML vector:
Dataset<Row> scaledDF = spark.createDataFrame(scaledRDD, VectorPair.class);
Finally, let's see how the resulting DataFrame looks:
scaledDF.show();
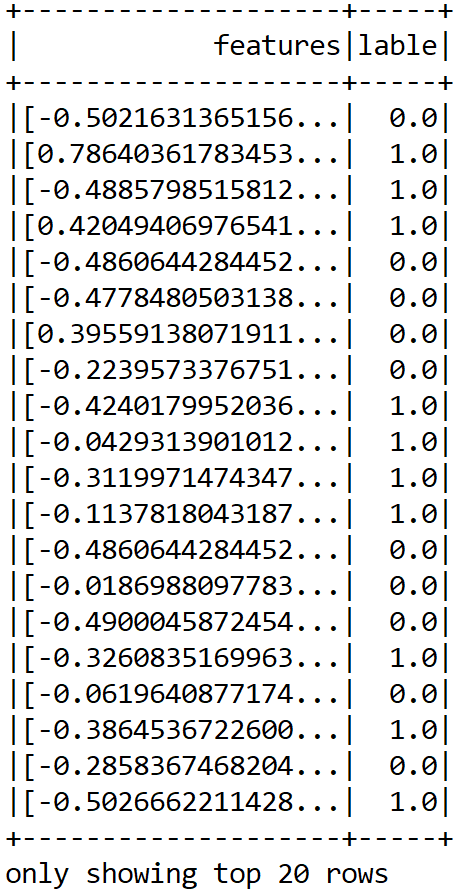
Up to this point, we have been able to prepare our features. Still, this is an MLlib-based vector, so we need to further convert this into an ML vector:
Dataset<Row> scaledData2 = MLUtils.convertVectorColumnsToML(scaledDF);
Fantastic! Now were' almost done preparing a training set that can be consumed by the MLP classifier. Since we also need to evaluate the model's performance, we can randomly split the training data for the training and test sets. Let's allocate 80% for training and 20% for testing. These will be used to train the model and evaluate the model, respectively:
Dataset<Row> data = scaledData2.toDF("features", "label");
Dataset<Row>[] datasets = data.randomSplit(new double[]{0.80, 0.20}, 12345L);

Dataset<Row> trainingData = datasets[0];
Dataset<Row> validationData = datasets[1];
Alright. Now that we have the training set, we can perform training on an MLP model.
Training MLP classifier
In Spark, an MLP is a classifier that consists of multiple layers. Each layer is fully connected to the next layer in the network. Nodes in the input layer represent the input data, whereas other nodes map inputs to outputs by a linear combination of the inputs with the node’s weights and biases and by applying an activation function.
Interested readers can take a look at https://spark.apache.org/docs/latest/ml-classification-regression.html#multilayer-perceptron-classifier.
So let's create the layers for the MLP classifier. For this example, let's make a shallow network considering the fact that our dataset is not that highly dimensional.
Let's assume that only 18 neurons in the first hidden layer and 8 neurons in the second hidden layer would be sufficient. Note that the input layer has 10 inputs, so we set 10 neurons and 2 neurons in the output layers since our MLP will predict only 2 classes. One thing is very important—the number of inputs has to be equal to the size of the feature vectors and the number of outputs has to be equal to the total number of labels:
int[] layers = new int[] {10, 8, 16, 2};
Then we instantiate the model with the trainer and set its parameters:
MultilayerPerceptronClassifier mlp = new MultilayerPerceptronClassifier()
                                          .setLayers(layers)
                                          .setBlockSize(128)
                                          .setSeed(1234L)
                                          .setTol(1E-8)
                                          .setMaxIter(1000);
So, as you can understand, the preceding MultilayerPerceptronClassifier() is the classifier trainer based on the MLP. Each layer has a sigmoid activation function except the output layer, which has the softmax activation. Note that Spark-based MLP implementation supports only minibatch GD and LBFGS optimizers.
In short, we cannot use other activation functions such as ReLU or tanh in the hidden layers. Apart from this, other advanced optimizers are also not supported, nor are batch normalization and so on. This is a serious constraint of this implementation. In the next chapter, we will try to overcome this with DL4J.
We have also set the convergence tolerance of iterations as a very small value so that it will lead to higher accuracy with the cost of more iterations. We set the block size for stacking input data in matrices to speed up the computation.
If the size of the training set is large, then the data is stacked within partitions. If the block size is more than the remaining data in a partition, then it is adjusted to the size of this data. The recommended size is between 10 and 1,000, but the default block size is 128.
Finally, we plan to iterate the training 1,000 times. So let's start training the model using the training set:
MultilayerPerceptronClassificationModel model = mlp.fit(trainingData);
Evaluating the MLP classifier
When the training is completed, we compute the prediction on the test set to evaluate the robustness of the model:
Dataset<Row> predictions = model.transform(validationData);
Now, how about seeing some sample predictions? Let's observe both the true labels and the predicted labels:
predictions.show();
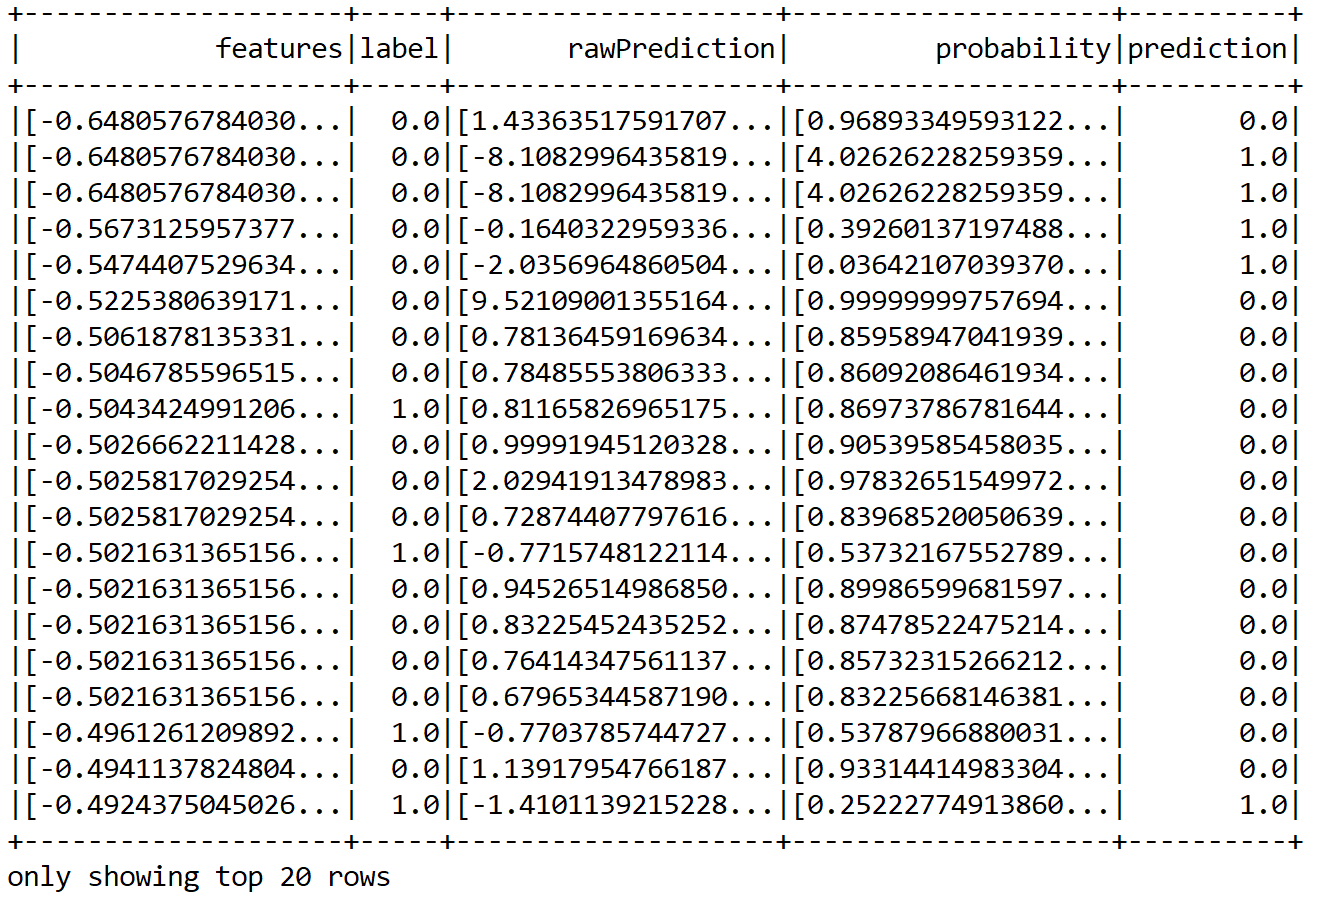
We can see that some predictions are correct but some of them are wrong too. Nevertheless, in this way, it is difficult to guess the performance. Therefore, we can compute performance metrics such as precision, recall, and f1 measure:
MulticlassClassificationEvaluator evaluator = new MulticlassClassificationEvaluator()
                                              .setLabelCol("label")
                                              .setPredictionCol("prediction");

MulticlassClassificationEvaluator evaluator1 = evaluator.setMetricName("accuracy");
MulticlassClassificationEvaluator evaluator2 = evaluator.setMetricName("weightedPrecision");
MulticlassClassificationEvaluator evaluator3 = evaluator.setMetricName("weightedRecall");
MulticlassClassificationEvaluator evaluator4 = evaluator.setMetricName("f1");
Now let's compute the classification's accuracy, precision, recall, f1 measure, and error on test data:
double accuracy = evaluator1.evaluate(predictions);
double precision = evaluator2.evaluate(predictions);
double recall = evaluator3.evaluate(predictions);
double f1 = evaluator4.evaluate(predictions);

// Print the performance metrics
System.out.println("Accuracy = " + accuracy);
System.out.println("Precision = " + precision);
System.out.println("Recall = " + recall);
System.out.println("F1 = " + f1);

System.out.println("Test Error = " + (1 - accuracy));
>>>
Accuracy = 0.7796476846282568
 Precision = 0.7796476846282568
 Recall = 0.7796476846282568
 F1 = 0.7796476846282568
 Test Error = 0.22035231537174316
Well done! We have been able to achieve a fair accuracy rate, that is, 78%. Still we can improve the with additional feature engineering. More tips will be given in the next section! Now, before concluding this chapter, let's try to utilize the trained model to get the prediction on the test set. First, we read the test set and create the DataFrame:
Dataset<Row> testDF = Util.getTestDF();
Nevertheless, even if you see the test set, it has some null values. So let's do null imputation on the Age and Fare columns. If you don't prefer using UDF, you can create a MAP where you include your imputing plan:
Map<String, Object> m = new HashMap<String, Object>();
m.put("Age", meanAge);
m.put("Fare", meanFare);

Dataset<Row> testDF2 = testDF.na().fill(m);
Then again, we create an RDD of vectorPair consisting of features and labels (target column):
JavaRDD<VectorPair> testRDD = testDF2.javaRDD().map(row -> {
            VectorPair vectorPair = new VectorPair();
            vectorPair.setLable(row.<Integer>getAs("PassengerId"));
            vectorPair.setFeatures(Util.getScaledVector(
                    row.<Double>getAs("Fare"),
                    row.<Double>getAs("Age"),
                    row.<Integer>getAs("Pclass"),
                    row.<Integer>getAs("Sex"),
                    row.<Integer>getAs("Embarked"),
                    scaler));
            return vectorPair;
        });
Then we create a Spark DataFrame:
Dataset<Row> scaledTestDF = spark.createDataFrame(testRDD, VectorPair.class);
Finally, let's convert the MLib vectors to ML based vectors:
Dataset<Row> finalTestDF = MLUtils.convertVectorColumnsToML(scaledTestDF).toDF("features", "PassengerId");
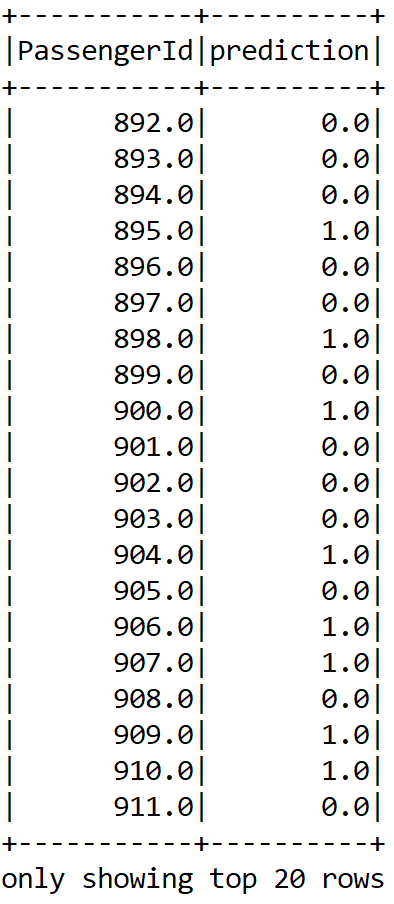
Now, let's perform the model inferencing, that is, create a prediction for the PassengerId column and show the sample prediction:
Dataset<Row> resultDF = model.transform(finalTestDF).select("PassengerId", "prediction");
resultDF.show();
Finally, let's write the result in a CSV file:
resultDF.write().format("com.databricks.spark.csv").option("header", true).save("result/result.csv");