

Shiny is based on HTML and hence it allows you to write an entire interface in R and Shiny without thinking of HTML. You can also update your interface using Shiny built-in functions or add custom HTML using the tag function. Shiny also allows you to write an entire interface using HTML from scratch. To work on a Shiny application for the first time, it is preferable that you are familiar with HTML and CSS.
The following are a few common HTML tags:
- p: This is used to create a paragraph
- h1-h6: Heading style used to add headings and subheadings, where h1 is considered to be the largest and h6 the smallest
- a: This is used to create links and it is associated with href, which is the address to the web page. For example, href = http://shiny.rstudio.com/articles/, "Shiny docs", where href is used to define the link and the following text is used to display the text to the user
- br(): This is used to create a line break
- div: This tag is used to define a section with a particular style, defined in the same way as we use a div tag in HTML
- span: The span tag is used to define a similar style to a string of text
- pre: This is used for format code sections or commands in block quotes or pre-formatted text
- code: We can also use the code tag if you want the code block to look the same as computer code
- img: The img tag is used to define the image
- strong: This is used to set the text in bold format
- em: The em tag is used to style the text in italics format or to emphasize the text
- hr: This is used to add a horizontal line between text
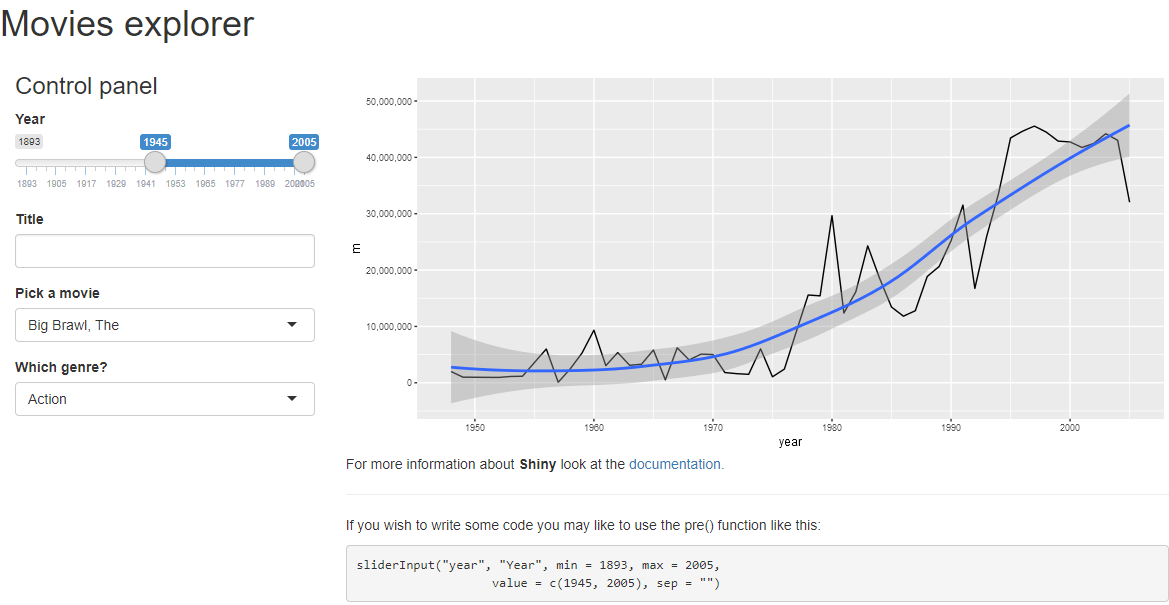
The following screenshot shows the use of some of the HTML tags:
Let's have a look at the code for the application present in the ui.r file:
mainPanel(
    tabsetPanel(
        tabPanel("Budgets over time", plotOutput("budgetYear"),
            p("For more information about ", strong("Shiny"), " look at the ",
            a(href = "http://shiny.rstudio.com/articles/",
              "documentation.")),
            hr(),
            h3("Some code goes under here"),
            p("If you wish to write some code you may like to use the pre()
            function like this:",
            pre('sliderInput("year", "Year", min = 1893, max = 2005,
                   value = c(1945, 2005), sep = "")'))),
        tabPanel("Movie picker", tableOutput("moviePicker"))
    )
)
As we can see in the code block, we have used a strong tag to add bold text within the p function within the same paragraph. We have also used href for the link, hr for the horizontal line, and the pre tag for the code block in the same application.