-
Book Overview & Buying
-
Table Of Contents

Metabase Up and Running
By :
Metabase Up and Running
By:
Overview of this book
Metabase is an open source business intelligence tool that helps you use data to answer questions about your business. This book will give you a detailed introduction to using Metabase in your organization to get the most value from your data.
You’ll start by installing and setting up Metabase on your local computer. You’ll then progress to handling the administration aspect of Metabase by learning how to configure and deploy Metabase, manage accounts, and execute administrative tasks such as adding users and creating permissions and metadata. Complete with examples and detailed instructions, this book shows you how to create different visualizations, charts, and dashboards to gain insights from your data. As you advance, you’ll learn how to share the results with peers in your organization and cover production-related aspects such as embedding Metabase and auditing performance. Throughout the book, you’ll explore the entire data analytics process—from connecting your data sources, visualizing data, and creating dashboards through to daily reporting.
By the end of this book, you’ll be ready to implement Metabase as an integral tool in your organization.
Table of Contents (15 chapters)
Preface

Section 1: Installing and Deploying Metabase
 Free Chapter
Chapter 1: Overview of Metabase
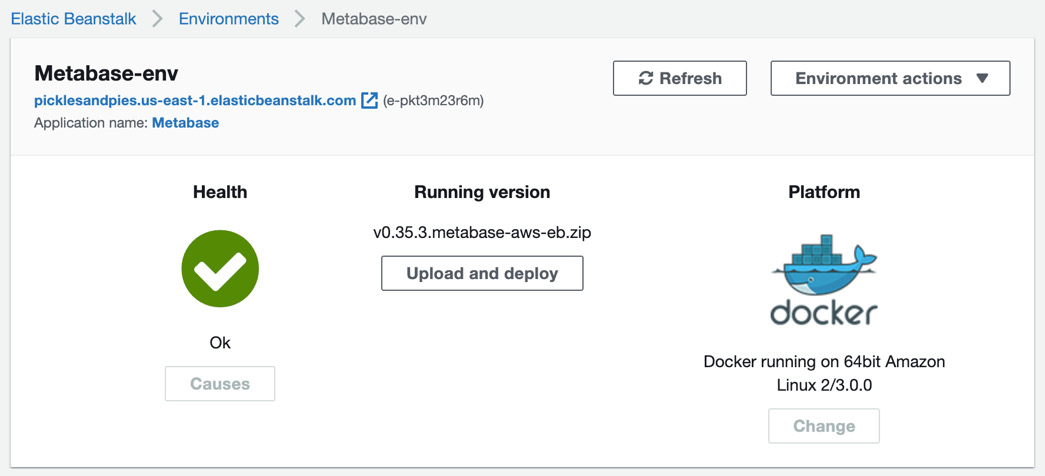
Chapter 2: Deploying Metabase with AWS
Section 2: Setting Up Your Instance and Asking Questions of Your Data
Chapter 3: Setting Up Metabase
Chapter 4: Connecting to Databases
Chapter 5: Building Your Data Model
Chapter 6: Creating Questions
Chapter 7: Creating Visualizations
Chapter 8: Creating Dashboards, Pulses, and Collections
Chapter 9: Using the SQL Console
Section 3: Advanced Functionality and Paid Features
Chapter 10: Advanced Features, Getting Help, and Contributing
Other Books You May Enjoy