-
Book Overview & Buying
-
Table Of Contents

Deep Learning from the Basics
By :
Deep Learning from the Basics
By:
Overview of this book
Deep learning is rapidly becoming the most preferred way of solving data problems. This is thanks, in part, to its huge variety of mathematical algorithms and their ability to find patterns that are otherwise invisible to us.
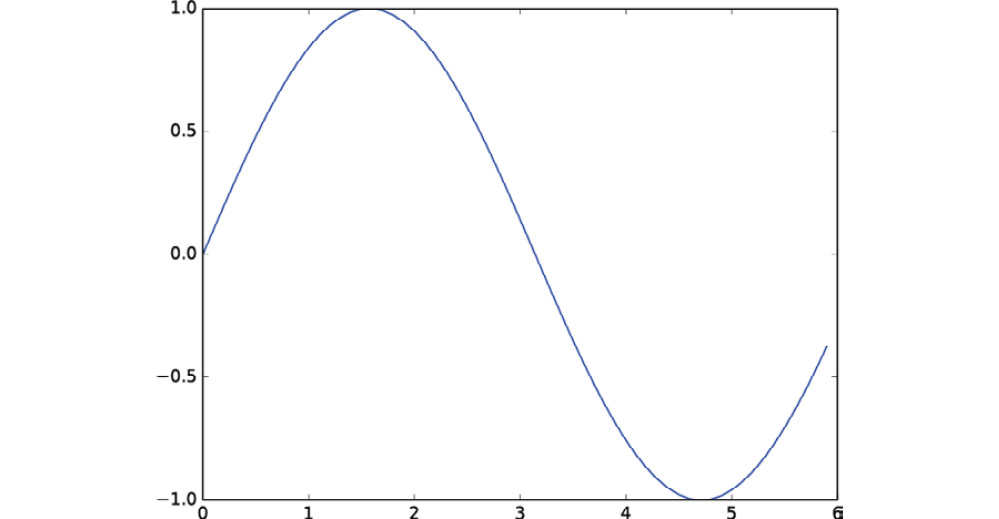
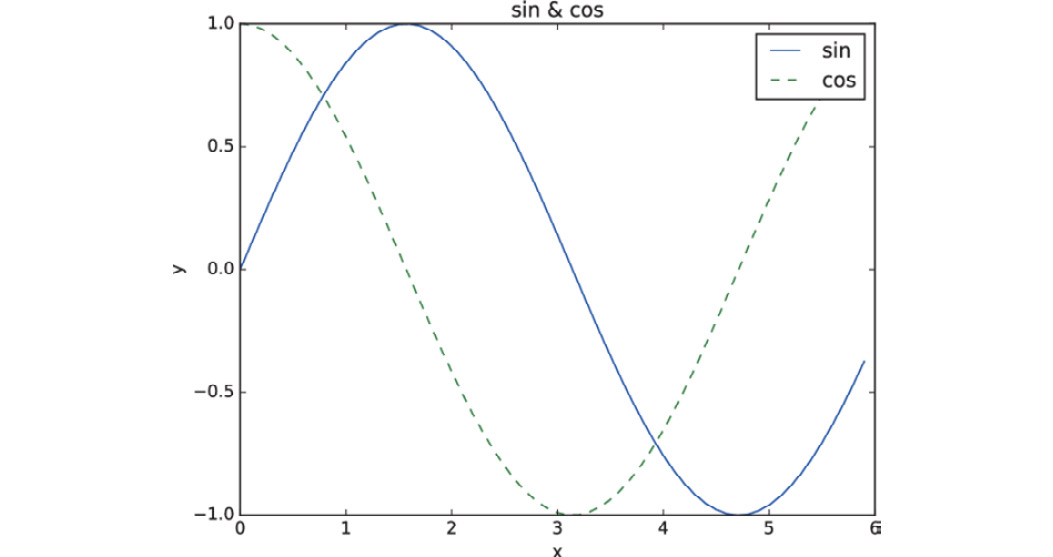
Deep Learning from the Basics begins with a fast-paced introduction to deep learning with Python, its definition, characteristics, and applications. You’ll learn how to use the Python interpreter and the script files in your applications, and utilize NumPy and Matplotlib in your deep learning models. As you progress through the book, you’ll discover backpropagation—an efficient way to calculate the gradients of weight parameters—and study multilayer perceptrons and their limitations, before, finally, implementing a three-layer neural network and calculating multidimensional arrays.
By the end of the book, you’ll have the knowledge to apply the relevant technologies in deep learning.
Table of Contents (11 chapters)
Preface

Introduction
 Free Chapter
1. Introduction to Python
2. Perceptrons
3. Neural Networks
4. Neural Network Training
5. Backpropagation
6. Training Techniques
7. Convolutional Neural Networks
8. Deep Learning