-
Book Overview & Buying
-
Table Of Contents

The Tableau Workshop
By :
The Tableau Workshop
By:
Overview of this book
Learning Tableau has never been easier, thanks to this practical introduction to storytelling with data. The Tableau Workshop breaks down the analytical process into five steps: data preparation, data exploration, data analysis, interactivity, and distribution of dashboards. Each stage is addressed with a clear walkthrough of the key tools and techniques you'll need, as well as engaging real-world examples, meaningful data, and practical exercises to give you valuable hands-on experience.
As you work through the book, you'll learn Tableau step by step, studying how to clean, shape, and combine data, as well as how to choose the most suitable charts for any given scenario. You'll load data from various sources and formats, perform data engineering to create new data that delivers deeper insights, and create interactive dashboards that engage end-users.
All concepts are introduced with clear, simple explanations and demonstrated through realistic example scenarios. You'll simulate real-world data science projects with use cases such as traffic violations, urban populations, coffee store sales, and air travel delays.
By the end of this Tableau book, you'll have the skills and knowledge to confidently present analytical results and make data-driven decisions.
Table of Contents (12 chapters)
Preface

1. Introduction: Visual Analytics with Tableau
 Free Chapter
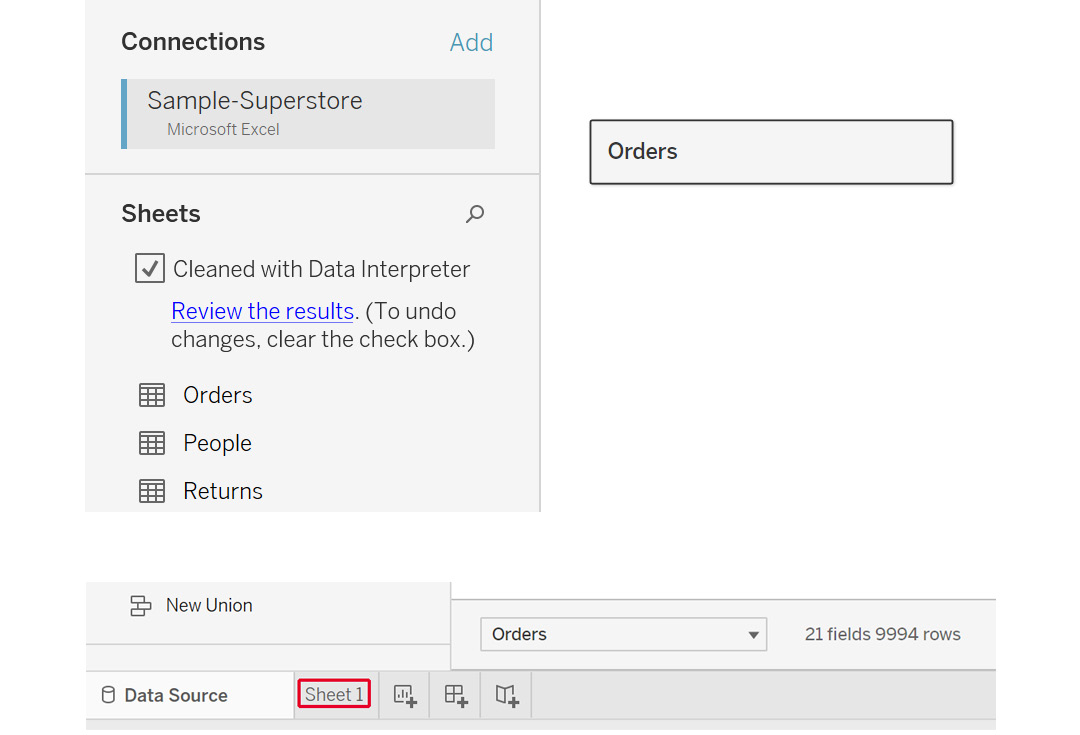
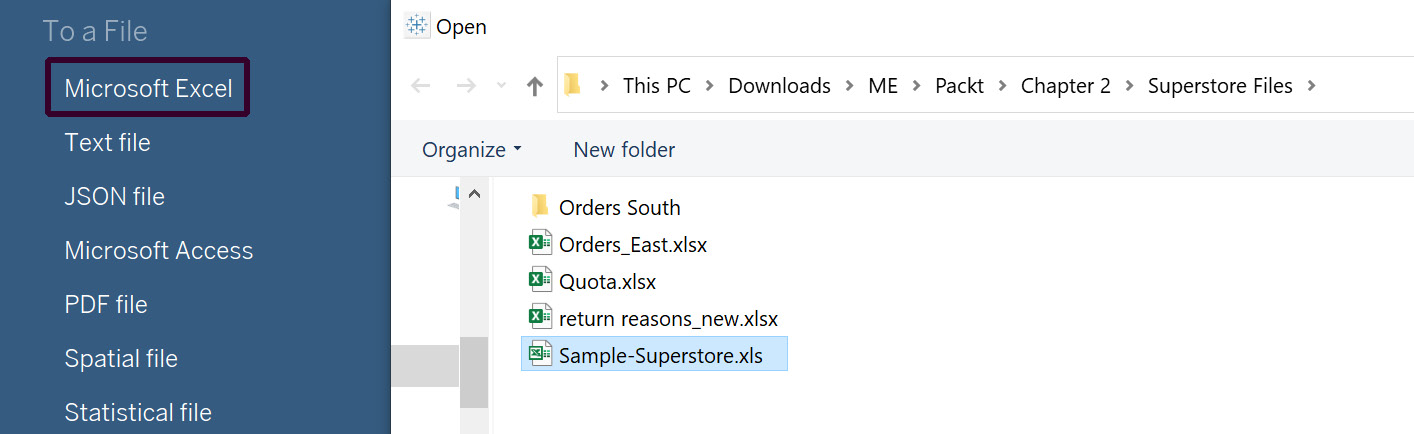
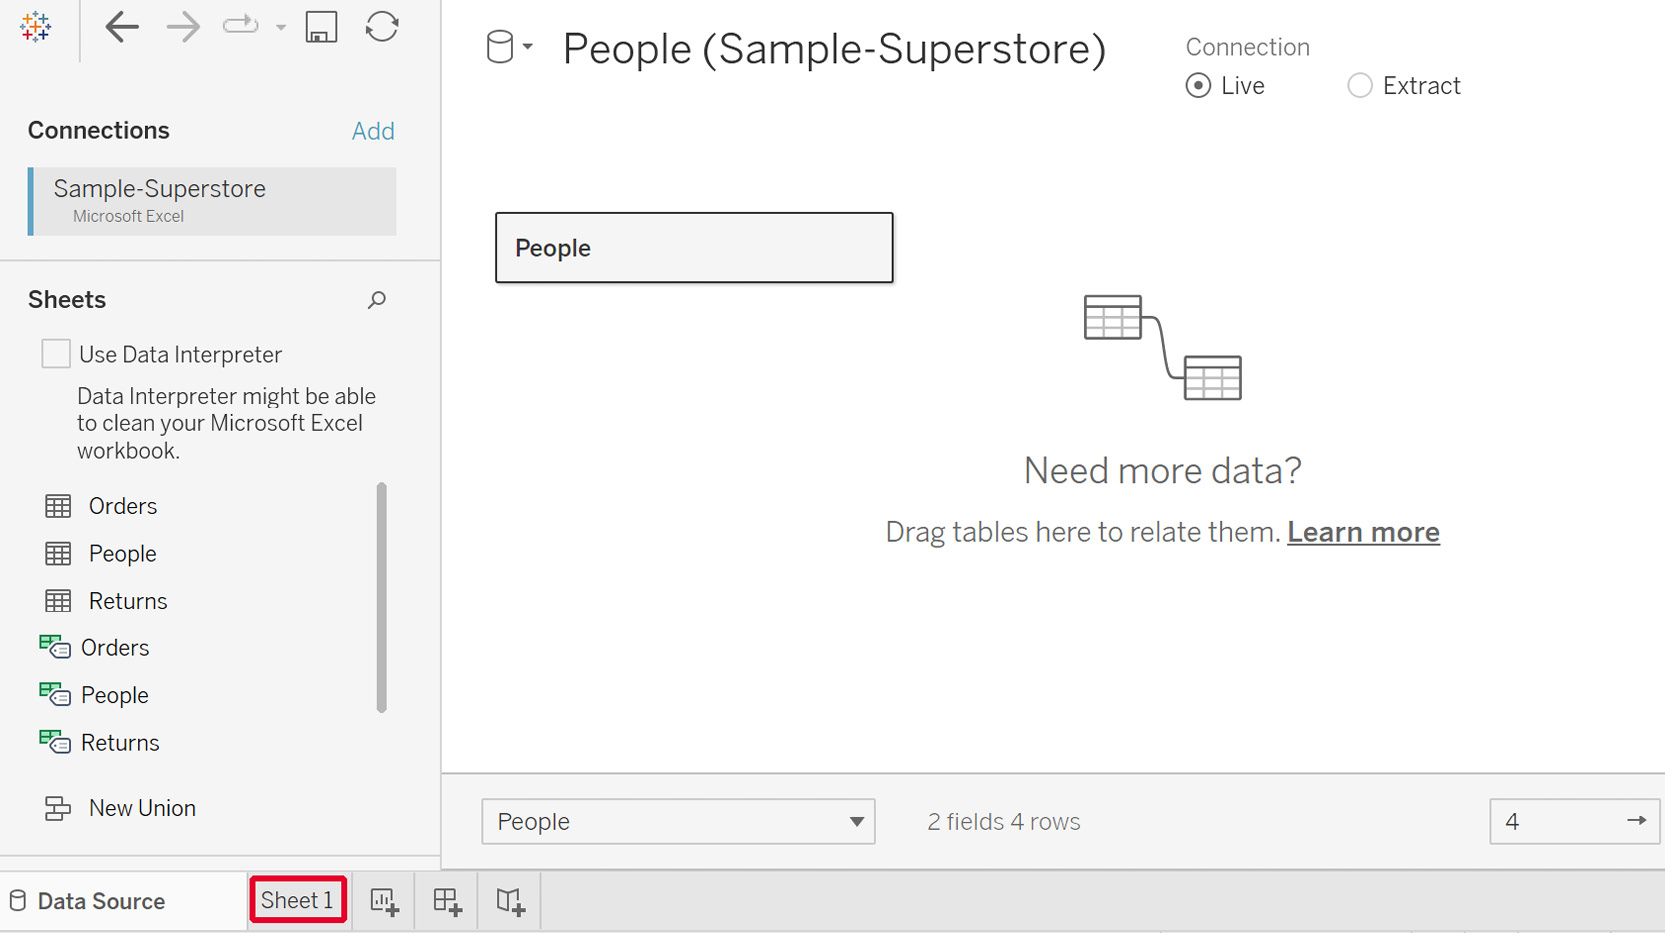
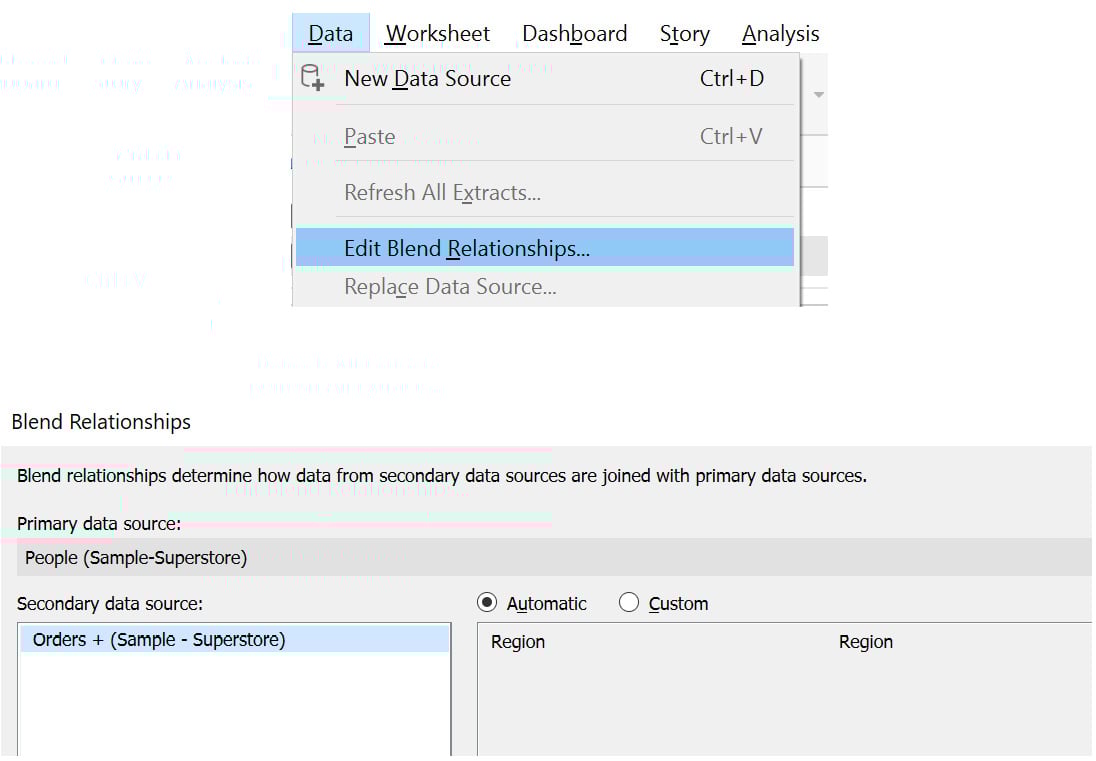
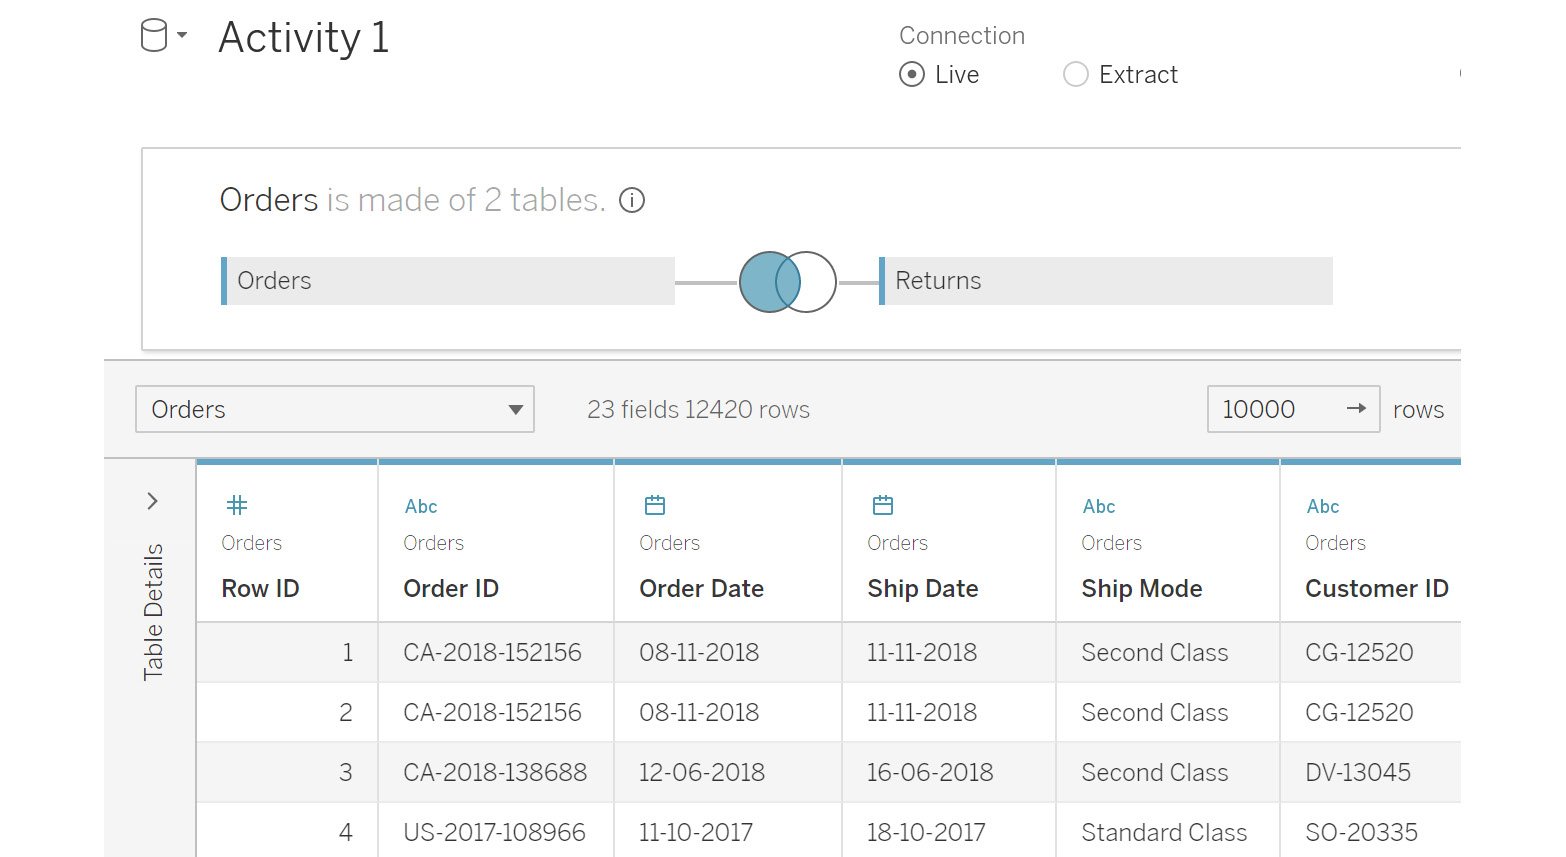
2. Data Preparation: Using Tableau Desktop
3. Data Preparation: Using Tableau Prep
4. Data Exploration: Comparison and Composition
5. Data Exploration: Distributions and Relationships
6. Data Exploration: Exploring Geographical Data
7. Data Analysis: Creating and Using Calculations
8. Data Analysis: Creating and Using Table Calculations
9. Data Analysis: Creating and Using Level of Details (LOD) Calculations
10. Dashboards and Storyboards
11. Tableau Interactivity: Part 1