

Creating Custom Columns
Business users often extend the outputs of existing reports and data models with additional columns to help them analyze and present data. The logic of these columns is generally implemented through Excel formulas or as calculated DAX columns. A superior solution, particularly if the logic cannot quickly be migrated to a data warehouse or IT resource, is to create the columns via the Power Query Editor and M language.
Developing custom columns can also significantly enhance the ease of use and analytical power of data models and the visualizations they support. In this recipe, columns are created to apply a custom naming format and simplify the analysis of a customer dimension via existing columns.
Getting ready
To get ready for this recipe, import the DimCustomer table from the AdventureWorksDW2019 database by doing the following:
- Open Power BI Desktop and choose Transform data from the ribbon of the Home tab to open the Power Query Editor.
- Create an Import mode data source query called
AdWorksDW. This query should be similar to the following:let Source = Sql.Database("localhost\MSSQLSERVERDEV", "AdventureWorksDW2019") in Source - Isolate this query in a query group called Data Sources.
- Right-click
AdWorksDWand choose Reference, select theDimCustomertable in the data preview area, and rename this queryDimCustomer.
For additional details on performing these steps, see the Managing Queries and Data Sources recipe in this chapter.
How to Create Custom Columns
To implement this recipe, perform the following steps:
- Use
Table.SelectColumnsto retrieve the required source columns from theDimCustomertable,FirstName,LastName,MiddleName,TitleandBirthDate.let Source = AdWorksDW, dbo_DimCustomer = Source{[Schema="dbo",Item="DimCustomer"]}[Data], SelectColumns = Table.SelectColumns(dbo_DimCustomer, {"FirstName", "LastName", "MiddleName", "Title", "BirthDate"} ) in SelectColumns - Write a
Table.AddColumnsfunction with anif...thenexpression that accounts for the different scenarios given a target format ofMr. John A. Doe:NameFormatTble = Table.AddColumn( SelectColumns,"Formatted Name", each if [Title] = null and [MiddleName] = null then [FirstName] & " " & [LastName] else if [Title] = null then [FirstName] & " " & Text.Range([MiddleName],0,1) & ". " & [LastName] else [Title] & " " & [FirstName] & " " & Text.Range([MiddleName],0,1) & ". " & [LastName] ) - Add variables that allow the expression to support the comparison between the current system date and the
BirthDatecolumn.let CurrentDate = DateTime.Date(DateTime.LocalNow()), CurrentYear = Date.Year(CurrentDate), CurrentMonth = Date.Month(CurrentDate), CurrentDay = Date.Day(CurrentDate), Source = AdWorksDW, - Use the
Table.AddColumnfunction to createCustomerYear,CustomerMonth, andCustomerDaycolumns based upon theBirthDatecolumn.AddCustomerYear = Table.AddColumn( NameFormatTble, "Customer Year", each Date.Year([BirthDate]), Int64.Type ), AddCustomerMonth = Table.AddColumn( AddCustomerYear, "Customer Month", each Date.Month([BirthDate]), Int64.Type ), AddCustomerDay = Table.AddColumn( AddCustomerMonth, "Customer Day", each Date.Day([BirthDate]), Int64.Type ) - Add an
Agecolumn via anif...thenexpression.CustomerAge = Table.AddColumn( AddCustomerDay,"Customer Age", each if [Customer Month] < CurrentMonth then CurrentYear - [Customer Year] else if [Customer Month] > CurrentMonth then CurrentYear - [Customer Year] - 1 else if [Customer Day] < CurrentDay then CurrentYear - [Customer Year] else CurrentYear - [Customer Year] - 1 ) - Add a
Customer Age Segmentcolumn via the column computed in step 4.CustomerSegment = Table.AddColumn( CustomerAge, "Customer Age Segment", each if [Customer Age] < 30 then "Less than 30" else if [Customer Age] < 40 then "30 to 39" else if [Customer Age] < 50 then "40 to 49" else if [Customer Age] < 60 then "50 to 59" else "60 or Older" )
How it works
In the NameFormatTble expression the Table.AddColumn function is used, coupled with an if...then expression. M is a case-sensitive language, so writing IF instead of if or Table.Addcolumn instead of Table.AddColumn will return an error. if...then expressions follow the following structure:
if <condition1> then <result1> else <result2>
All three inputs (condition1, result1, and result2) accept M expressions. if expressions can be nested together with the following structure:
if <condition1> then <result1> else if <condition2> then <result2> else <result3>
The equivalent of a SQL CASE expression is not available in M. However, the order of conditions specified in if...then expressions drives the evaluation process. Multiple conditions could be true but the second and later conditions will be discarded and not evaluated. If the value produced by the if condition is not a logical value, an error is raised.
The three if...then conditions in the NameFormatTble expression account for all scenarios to return the formatted name, since the query must account for nulls in the Middle Name and Title columns, as well as different values in the Middle Name column. Text.Range is used to extract the first character of the middle name.
For the variables CurrentDate, CurrentYear, CurrentMonth, and CurrentDay, the DateTime.LocalNow function is used as the source for the current date; it is then used for year, month, and day.
For the AddCustomerYear, AddCustomerMonth, and AddCustomerDay expressions, the Int64.Type value is passed to the optional type parameter of Table.AddColumn to set the new columns as whole numbers.
For the CustomerAge and CustomerSegment expressions, nested if…then expressions are used. This method is used because, currently, the equivalent of a DATEDIFF function (T-SQL, DAX) with date intervals like Year, Month, Week, and so on, are not available in M. A Duration.Days function can be used for day intervals and additional duration functions are available for hour, minute, and second intervals.
The CustomerAge expression compares the CurrentMonth and CurrentDay variables against the values of the customer columns created in the AddCustomerMonth and AddCustomerDay expressions in order to compute the age of the customer using the CurrentYear variable and the column created by the AddCustomerYear expression. The column created by the CustomerAge column is then used in the CustomerSegement expression to derive the age segmentation column. The new custom columns can be used to support various visualizations based upon the ages and segmentation of customers.
There's more...
The Power Query Editor provides graphical user interfaces for adding columns. These interfaces provide mechanisms for adding columns that are an alternative to writing out the code manually. In essence, the M code for the added columns is generated as an output from these interfaces.
One such interface is the Column From Examples feature, which allows users to simply type examples of a desired column's output. The engine determines which M functions and series of steps to add to the query that return results consistent with the examples provided. To explore this feature, follow these steps:
- Create a new query referencing the AdWorksDW query.
- Select the DimCustomer table.
- Select the Title, FirstName, MiddleName, LastName, and BirthDate columns and remove all other columns.
- Select the Add Column tab and then choose the Column From Examples button in the ribbon.

Figure 2.33: Column From Examples feature
- Type the customer's
FirstName,MiddleName, andLastNamevalues into the first row and hit the Enter key. Notice that the rest of the rows are automatically calculated based upon this first row.
Figure 2.34: Column From Examples interface
- Click the OK button to accept the transformation.
Another interface for adding columns is the Condition Column feature. This feature provides a method of creating conditional columns as an alternative to writing out the if...then expressions. To see how this feature operates, follow these steps:
- Select the Add Column tab and then select Conditional Column from the ribbon.

Figure 2.35: Conditional Column feature
- Fill in the fields on the Add Conditional Column dialog, using the Add Clause button to add additional
else ifstatements; click the OK button to exit the dialog and create the new column.
Figure 2.36: Add Conditional Column dialog
Any column from the table can be referenced, and multiple created steps can be moved up or down the order of evaluation using the ellipses (…). Open the Advanced Editor to inspect the code created.
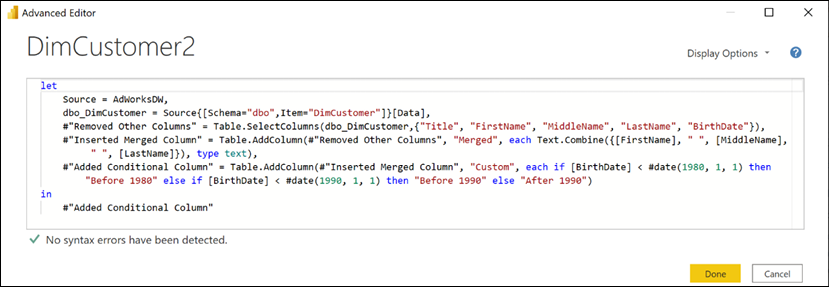
Figure 2.37: Added conditional column M code
See also
Table.AddColumn: http://bit.ly/3vGJZ6bTable.SelectColumns: http://bit.ly/38Qk7LtDateTimefunctions: http://bit.ly/3tPtKlJ- Add Column From examples: http://bit.ly/3eWTLv6