
EdgeSight provides a centralized console to investigate problems related to sessions, applications, systems, and networks without requiring us to somehow log in or connect to the device having the problem.
The important thing here is that the end device you are troubleshooting should have the EdgeSight agent installed.
To get the real-time performance data of a device, navigate to Troubleshoot | Device Troubleshooter.
Either enter the IP address or the name of the device you are troubleshooting in the Search field or browse in the department tree.
You can also use the slider to change the time frame for the data you want to be displayed.
Click on the Go button.

Click on the System Summary tab and look for important counters here such as Committed Bytes In Use, which displays the usage of the system memory.

Click on the counter you want to have a much deeper look at and EdgeSight will display more detailed information in a pop-up window. You can also click on a point on the pop-up chart to display point-in-time data for the counter.

In cases where the device is a XenApp server running a basic-level agent, data will not be displayed in some of the tabs; instead, a message is displayed in each affected tab.
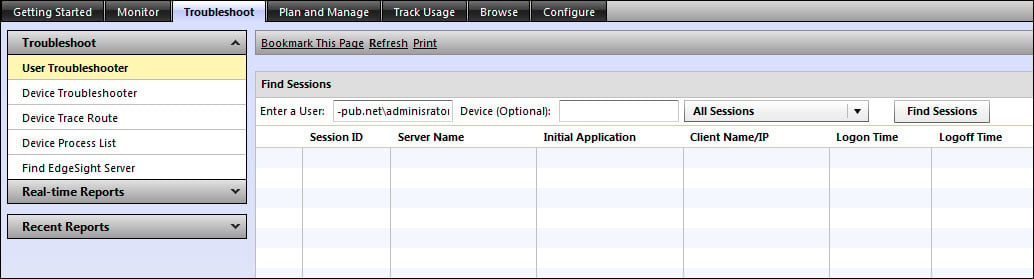
Similar to Device Troubleshooter, the User Troubleshooter page can be used to display detailed performance data for sessions across a farm for any specified user. You will need to provide the username, and optionally the name of the server hosting the session, and then click on Find Sessions.
Several steps are involved from the time a user clicks on the icon of a published application to launch and use the application till the time the application finally launches. EdgeSight for XenApp can be used to diagnose those slow logins or slow sessions problems reported by the users; it lets you examine the steps involved and the time required to complete each step.
If no default credentials were specified for the farm before, then you can click on the browse button  and provide the credentials in the Find a XenApp Session – Webpage Dialog window.
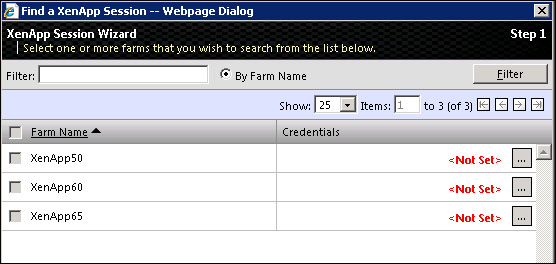
You can specify unique credentials for each XenApp farm in your environment.
You can also use the Device Process List page to display detailed information about processes that are currently running on the selected device.
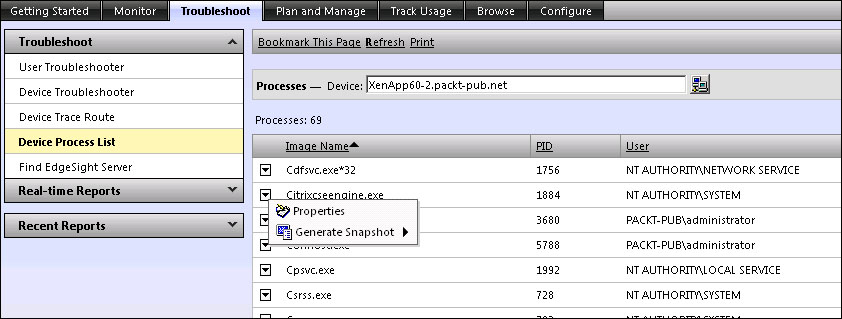
You can also generate a diagnostic snapshot (Normal or Full), which allows us to remotely analyze the current state of the selected device and investigate whether a particular process is the cause of the problem you are investigating. The snapshot generates a dump file on the selected device and is also uploaded to the server as an alert.
One other very useful troubleshooting tool here is the Device Trace Route tool.
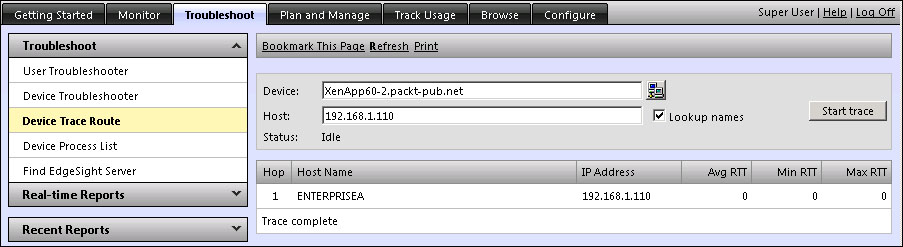
The Device Trace Route tool can be used to identify and route problems you may have; it allows you to execute a trace route from the selected remote device to a specified network host.