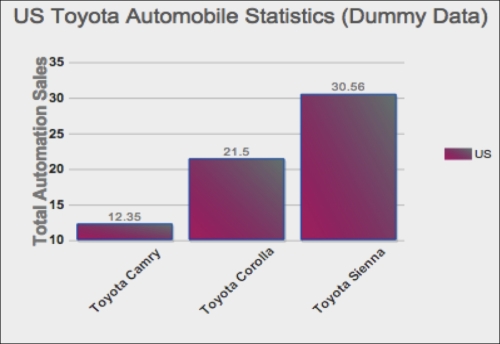
A column bar chart widget is slightly different from the regular bar chart widget we previously created. Remember we also had a look at some of the useful and common options used by most Wijmo developers. The last one we listed was the horizontal option of type Boolean. The default value of the horizontal option is true. This implies that the bar chart will be rendered in a horizontal layout by default.
For the creation of our first column bar chart, we shall proceed by setting the horizontal option to false, using the same code used for the previous bar chart we had created. Here's our new complete code:
<html>
    <head>
<!--jQuery References-->
<script src="http://ajax.aspnetcdn.com/ajax/jquery/jquery-1.7.1.min.js" type="text/javascript"></script>
<script src="http://ajax.aspnetcdn.com/ajax/jquery.ui/1.8.17/jquery-ui.min.js" type="text/javascript"></script>
<!--Wijmo Widgets JavaScript-->
<script src="http://cdn.wijmo.com/jquery.wijmo-open.all.2.0.0.min.js" type="text/javascript"></script>
<script src="http://cdn.wijmo.com/jquery.wijmo-complete.all.2.0.0.min.js" type="text/javascript"></script>
<!--Theme-->
<link href="http://cdn.wijmo.com/themes/rocket/jquery-wijmo.css" rel="stylesheet" type="text/css" title="rocket-jqueryui" />
<!--Wijmo Widgets CSS-->
<link href="http://cdn.wijmo.com/jquery.wijmo-complete.all.2.0.0.min.css" rel="stylesheet" type="text/css" />
</head>
<body>
<div id="wijbarchart" class="ui-widget ui-widget-content ui-corner-all" style="width: 400px;
height: 300px">
</div>

<script id="scriptInit" type="text/javascript">
        $(document).ready(function () {
    //activating the wijbarchart function on #wijbarchart
            $("#wijbarchart").wijbarchart({
            horizontal: false,//makes it vertical
            axis: { //set up the x and y axes
                y: {
                    text: "Total Automation Sales",

                },
                x: {
                    text: "",
                    labels: {
                        style: {
                            rotation: -45
                        }
                    }
                }
            },

                hint: { //hint text when hovering over chart
                    content: function () {
                        return this.data.label + '\n ' + this.y + '';
                    }
                },

                header: {//chart title
                    text: "US Toyota Automobile Statistics (Dummy Data)"
                },
       //data for chart representing each column
                seriesList: [{
                    label: "US",
                    legendEntry: true,
                    data: { x: ['Toyota Camry', 'Toyota Corolla', 'Toyota Sienna'], y: [12.35, 21.50, 30.56] }
                }],

               seriesStyles: [{
                fill: "40-#BD0070-#718680", stroke: "#1261C0", opacity: 0.7
               }],

                seriesHoverStyles: [{ "stroke-width": "1.5", opacity: 1
                }]
            });
        });
    </script>
    </body>
</html>
Notice from the preceding code, which we will hereon refer to as the main code, that we set the horizontal option to false. Now, when we run the main code, we should see a column bar chart widget as follows:

That's how simple switching from a regular bar chart to a column bar chart is. The choice between either of the two bar charts is usually dependent on user preference.
We reference the Wijmo dependencies as follows:
After the page loads, we set the
horizontalproperty tofalse.The
xandyproperties are set, andyis rotated at-45degrees, which rotates the labels for Toyota Camry, Toyota Corolla, and Toyota Sienna.We set the
hintproperty, which is displayed on hovering over the chart.We set the
headerproperty, which is displayed atop the grid.For the
seriesListproperty, we have adatasubproperty that holds data forxandy. These values are mapped one-to-one in such a way thatx['Toyota Camry']getsy[0]ory[12.35].For the
seriesStylesproperty, we set the gradient color as"40-#BD0070-#718680"and set theopacityvalue as0.7.


