Sign In Start Free Trial
Account

Add to playlist

Create a Playlist

Modal Close icon
You need to login to use this feature.
  • Book Overview & Buying Learning Splunk Web Framework
  • Table Of Contents Toc
Learning Splunk Web Framework

Learning Splunk Web Framework

By : Vincent Sesto
4 (2)
close
close
Learning Splunk Web Framework

Learning Splunk Web Framework

4 (2)
By: Vincent Sesto

Overview of this book

Building rich applications on the Web using Splunk is now simpler than ever before with the Splunk Web Framework. It empowers developers to build their own web applications with custom dashboards, tables, charts, form searches, and other functionalities in the datasets at their disposal. 
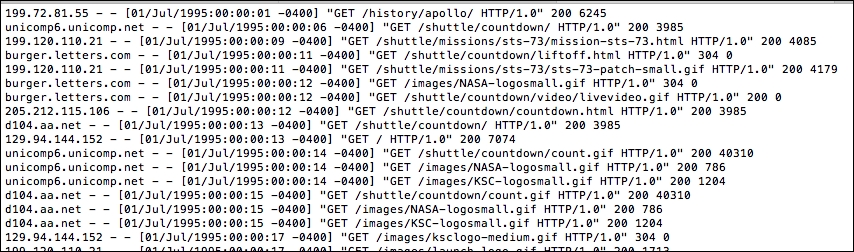
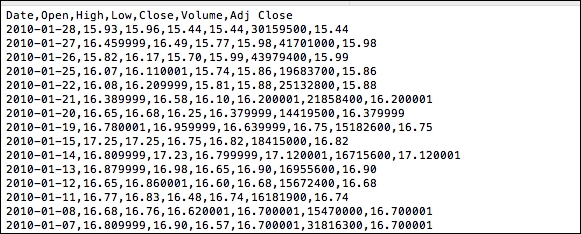
The book will start with the fundamentals of the Splunk Web Framework, teaching you the secrets of building interesting and user-friendly applications. In the first application, you will learn to analyze and monitor traffic hitting the NASA website and learn to create dashboards for it. You will then learn additional, and more detailed, techniques to enhance the functionalities of the app such as dashboards and forms, editing simple XML, using simple XML extensions, tokens, post-process searches, dynamic drill-downs, the Splunk Web Framework and REST API, and much more. The second app will use historical stock market data and will create custom dashboards using Splunk Web Framework; the book will now cover important topics such as creating HTML dashboards, enhancing the visual appeal of the app using CSS, and moving your app with SplunkJS. 
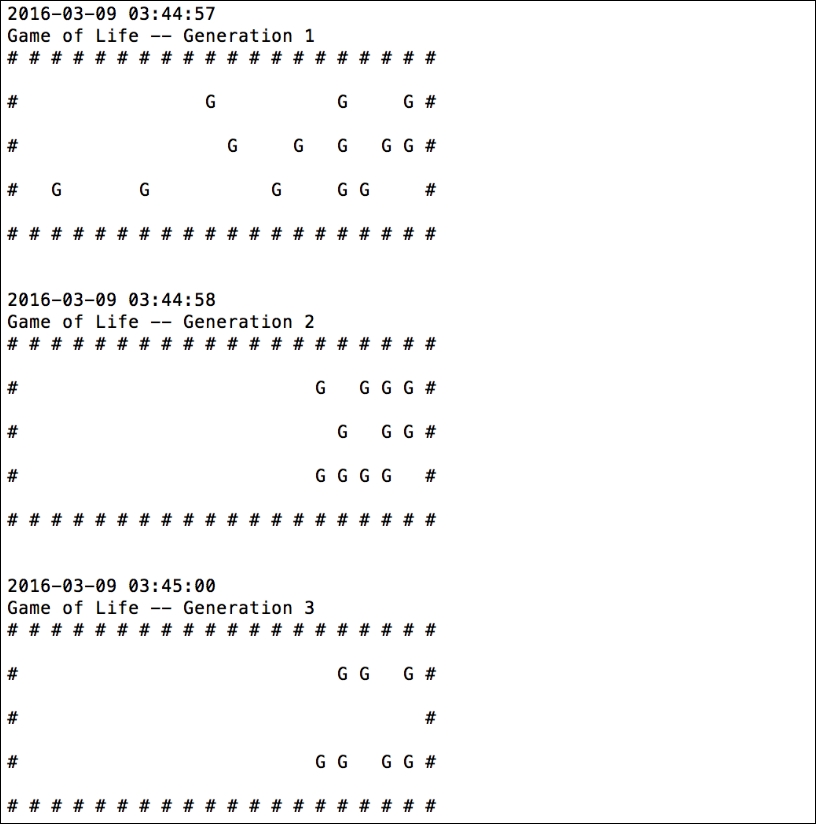
The book will provide different and interesting examples instead of the usual “Log, Index, Search, and Graph” so that Splunk will be the first tool readers think of to resolve a problem.
Table of Contents (10 chapters)
close
close

Introducing the example projects

This is a good time to introduce the example projects that we are going to work on in the book. The three examples are varied in the type of data they are presenting, in the hope that the examples will present the user with different ways of visualizing and working with different data. It may be worth getting the data indexed so that you can start to get an idea of what we will be working with.

NASA HTTP data

Although the data is a little old, I think it can give an interesting insight into the web traffic for the NASA website. The data is from 1995 and contains two traces of two months of all HTTP requests to the web server at the Kennedy Space Centre in Florida. The log files are Squid proxy logs and provide details on the host making the request, timestamp, request being made, HTTP reply code, and bytes in the reply.

A download of the data can be found at the following location: http://ita.ee.lbl.gov/html/contrib/NASA-HTTP.html.

NASA HTTP data

The example projects will help analyze the web traffic hitting the NASA website and provide visualization and insights into the site's usage. The data will allow us to start with basic visualizations within the SplunkWeb Framework.

Game of life

If you have been working in development, even for a short period of time, I am sure you will have heard of Conway's Game of Life. Even though it's called a game, it's more of a simulation of biological cells, where we can watch the cells evolve to either live or fail. The cells are governed by a set of rules that determines if they live or die through each generation or step in the simulation:

  1. Any live cell with fewer than two live neighbors will die, as if caused by under-population.
  2. Any live cell with two or three live neighbors lives on to the next generation.
  3. Any live cell with more than three live neighbors dies, as if caused by overpopulation.
  4. Any dead cell with exactly three live neighbors becomes a live cell, as if caused by reproduction.

The logs presented here are random, but will consist of the grid where the cells will live, a timestamp, and the cells that are present through each generation of the life cycle (https://en.wikipedia.org/wiki/Conway%27s_Game_of_Life).

I have created a GitHub repository with a basic example of Conway's Game Of Life, but I have also produced logs for the script for 2 hours to give you some sample data that can be worked with through the examples. The sample Python script and log file can be found by going to the following link:  https://github.com/vincesesto/game_of_life_splunk.

From here, you can index the file called game_of_life.log. If you are using at least version 6 of Splunk, the logs will be indexed correctly with the events separated correctly for each date and timestamp. The sample log file will look similar to the following image:

Game of life

The example data that we have will allow us to analyze the simulation of cells, and although the data is not very complex, we should hopefully provide some interesting visualizations and take our skills with the Splunk Web Framework further.

Historical stock market data

Yahoo! Finance provides an API that allows people to download historical stock market data directly to their environment. In our example, we will take a few different companies and download their historical data for the year 2015, displaying the date stamp, opening value for the day, highest value of the day, lowest value for the day, closing value, volume traded for the day, and adjusted close value of the stock. The sample data will be in CSV form and the API call will be similar to the following URL:  http://ichart.finance.yahoo.com/table.csv?s=YHOO&d=0&e=28&f=2016&g=d&a=3&b=12&c=2015&ignore=.csv.

The API call is pretty straightforward and the commands are listed here:

  • s: Company symbol (Yahoo!)
  • d: To month -1
  • e: To day
  • f: To year
  • g: Set up of date (d for day, m for month, y for yearly)
  • a: From month -1
  • b: From day (two digits)
  • c: From year

For more details on different company symbols and more explanations of the data that the API can provide, go to the Yahoo! Finance site at https://finance.yahoo.com/.

Historical stock market data

The data presented is an interesting sample is varied, allowing for interesting trend analysis. This is where we will take our skills further and start to use more of the advanced features of the Splunk Web Framework.

CONTINUE READING
83
Tech Concepts
36
Programming languages
73
Tech Tools
Icon Unlimited access to the largest independent learning library in tech of over 8,000 expert-authored tech books and videos.
Icon Innovative learning tools, including AI book assistants, code context explainers, and text-to-speech.
Icon 50+ new titles added per month and exclusive early access to books as they are being written.
Learning Splunk Web Framework
notes
bookmark Notes and Bookmarks search Search in title playlist Add to playlist download Download options font-size Font size

Change the font size

margin-width Margin width

Change margin width

day-mode Day/Sepia/Night Modes

Change background colour

Close icon Search
Country selected

Close icon Your notes and bookmarks

Confirmation

Modal Close icon
claim successful

Buy this book with your credits?

Modal Close icon
Are you sure you want to buy this book with one of your credits?
Close
YES, BUY

Submit Your Feedback

Modal Close icon
Modal Close icon
Modal Close icon