

Data-finding techniques used in web pages
To extract data from websites or web pages, we must identify where exactly the data is located. This is the most important step in the case of automating data collection from the web.
When we browse or request any URL in a web browser, we can see the contents as responses to us. These contents can be some dynamically added values or dynamically generated or rendered to the HTML templates by processing some API or JavaScript code. Knowing the URL of response content or finding the availability of content in some files is the first action toward scraping. Content can also be retrieved using third-party sources or sometimes even embedded in a view to end users.
In this section, we will explore a few key techniques that will help us identify, search for, and locate contents we have received via a web browser.
HTML source page
Web browsers are used for client-server-based GUI interaction to explore web content. The browser address bar is supplied with the web address or URL, the requested URL is communicated to the server (host), and a response is received, which means it is loaded by the browser. This obtained response or page source can be further explored and searched for the desired content in raw format.
Important note
You are free to choose which web browser you wish to use. Most web browsers will display the same or similar content. We will be using Google Chrome for most of the book’s examples, installed on the Windows OS.
To access the HTML source page, follow these steps:
- Open https://www.google.com in your web browser (you can try the same scenario with any other URL).
- After the page is loaded completely, right-click on any section of the page. The menu shown in Figure 1.5 should be visible, with the View page source option:
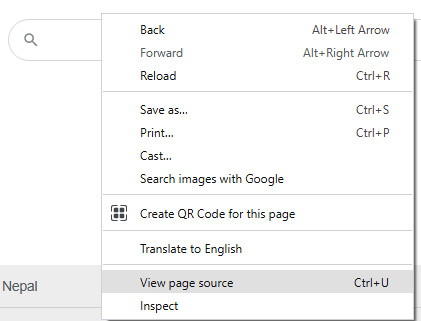
Figure 1.5: View page source (right-click on any page and find this option)
- If you click the View page source option, it will load a new tab in the browser, as seen in Figure 1.6:
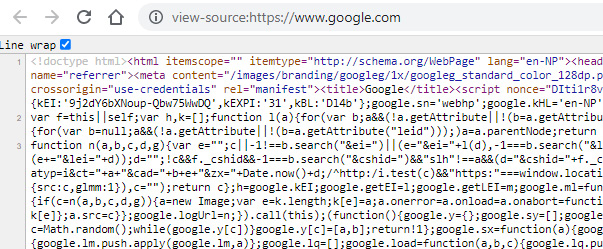
Figure 1.6: Page source (new tab loaded in the web browser, with raw HTML)
You can see that a new tab will be added to the browser with the text view-source: prepended to the original URL, https://www.google.com. Also, if we add the text view-source: to our URL, once the URL loads, it displays the page source or raw HTML.
Important note
You can try to find any text or DOM element in the web browser by searching inside the page source. Load the URL https://www.google.com and search web scraping. Find some of the content displayed by Google using the page source.
We now possess a basic idea of data-finding techniques. The technique we used in this section is a primary or base concept. There are a few more techniques that are more sophisticated and come with a large set of functionality and tools, which help or guide us in the data-finding context – we will cover them in the next section.
Developer tools
DevTools are found embedded within most browsers on the market today. Developers and end users alike can identify and locate resources and search for web content that is used during client-server communication, or while engaged in an HTTP request and response.
DevTools allow a user to examine, create, edit, and debug HTML, CSS, and JavaScript. They also allow us to handle and figure out performance problems. They facilitate the extraction of data that is dynamically or securely presented by the browser.
DevTools will be used for most data extraction cases. For more detailed information on DevTools, here are some links:
- Google Chrome: https://developer.chrome.com/docs/devtools/
- Firefox: https://firefox-source-docs.mozilla.org/devtools-user/
Similar to the View page source option, as discussed in the HTML source page section, we can find the Inspect menu option, which is another option for viewing the page source, when we right-click on a web page.
Alternatively, you can access DevTools via the main menu in the browser. Click More tools | Developer tools, or press Ctrl + Shift + I, as seen in Figure 1.7:
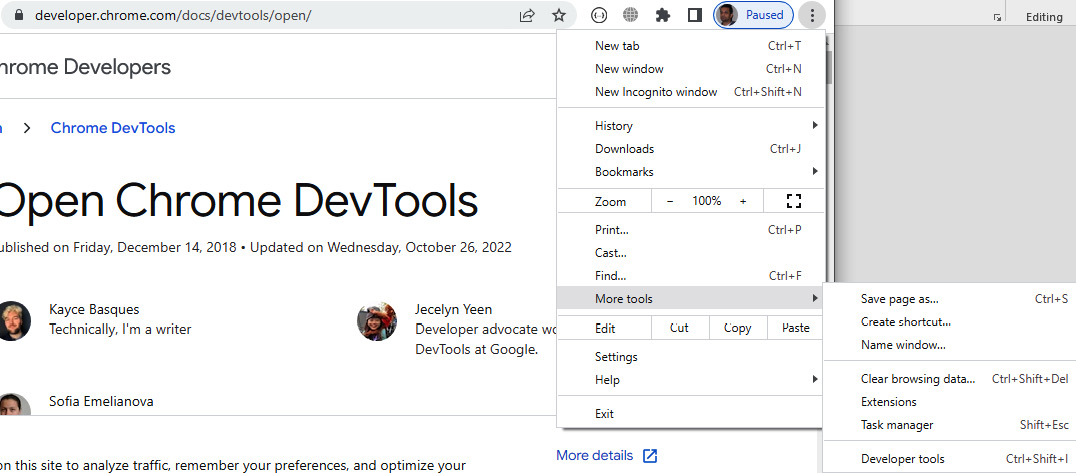
Figure 1.7: Accessing DevTools (web browser menu bar)
Let’s try loading the URL https://en.wikipedia.org/wiki/FIFA in the web browser. After the page gets loaded, follow these steps:
- Right-click the page and click the Inspect menu option.
We’ll notice a new menu section with tabs (Elements, Console, Sources, Network, Memory, and more) appearing in the browser, as seen in Figure 1.8:
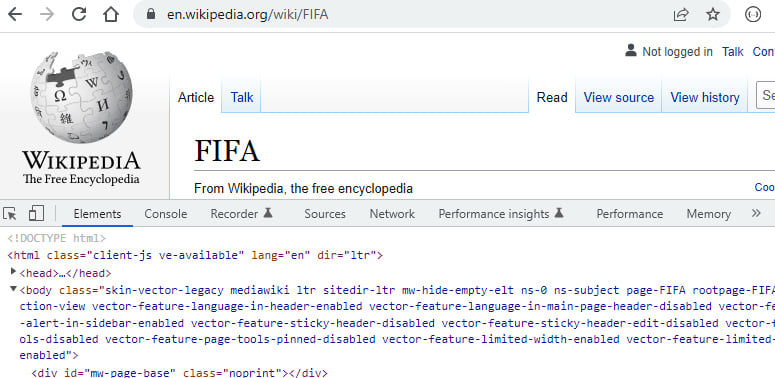
Figure 1.8: Inspecting the DevTools panels
- Press Ctrl + Shift + I to access the DevTools or click the Network tab from the Inspect menu option, as shown in Figure 1.9:
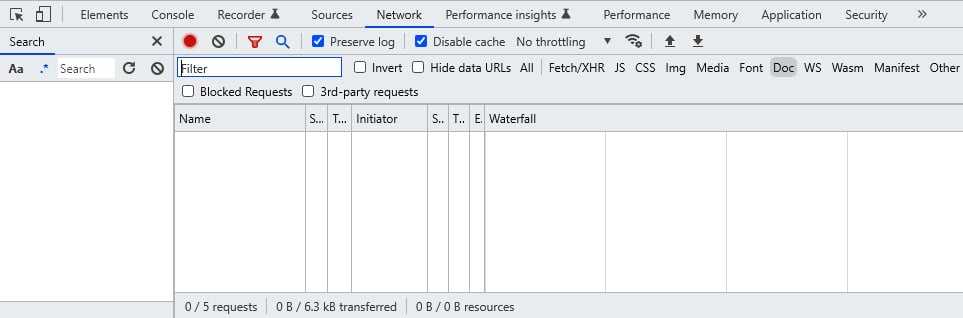
Figure 1.9: DevTools Network panel
Important note
The Search and Filter fields, as seen in Figure 1.9, are often used to find content in the HTML page source or other available resources that are available in the Network panel. The Search box can be supplied with a regex pattern – case-sensitive information to find or locate content statically or dynamically.
All panels and tools found inside DevTools have a designated role. Let’s get a basic overview of a few important ones next.
Exploring DevTools
Here is a list of all the panels and tools found in DevTools:
- Elements: Displays the HTML content of the page viewed. This is used for viewing and editing the DOM and CSS, and for finding CSS selectors and XPath content. Figure 1.10 shows the icon as found in the Inspect menu option, which can be clicked and moved to the HTML content in the page or code inside the Elements panel, to locate HTML tags or XPath and DOM element positions:

Figure 1.10: Element inspector or selector
This icon acts similarly to the mouse cursor moving across the screen. We will explore CSS selectors and XPath further in Chapter 3.
Important note
HTML elements displayed or located in the Elements or Network | Doc panel may not be available in the page source.
- Console: Used to run and interact with JavaScript code, and to view log messages.
- Sources: Used to navigate pages and view available scripts and document sources. Script-based tools are available for tasks such as script execution (that is, resuming and pausing), stepping over function calls, activating and deactivating breakpoints, and handling exceptions.
- Network: Provides us with HTTP request and response-related resources. Resources found here feature options such as recording data to network logs, capturing screenshots, filtering web resources (JavaScript, images, documents, and CSS), searching web resources, and grouping web resources, and can also be used for debugging tasks. Figure 1.11 displays the HTTP request URL, request method, status code, and more, by accessing the Headers tab from the Doc option available inside the Network panel.
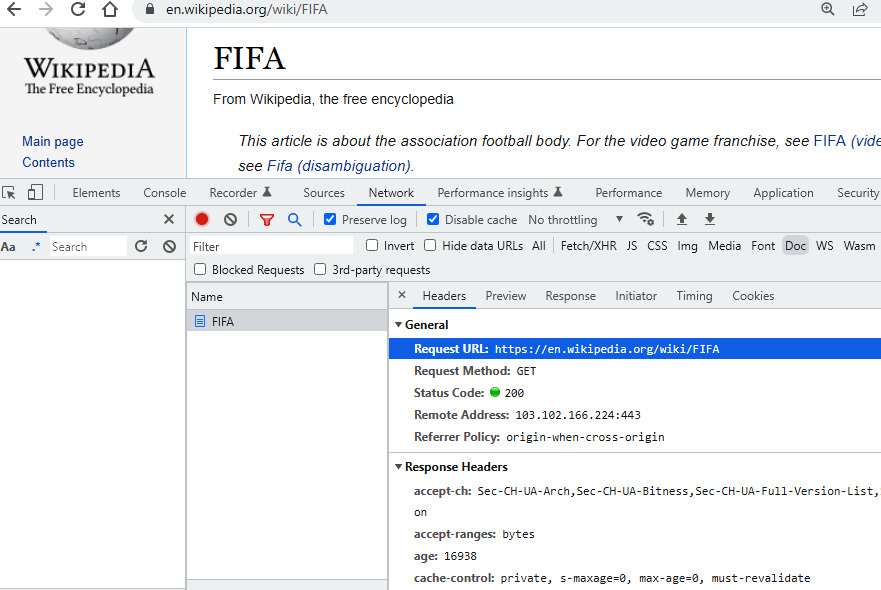
Figure 1.11: DevTools – Network | Doc | Headers option (HTTP method and status code)
Network-based requests can also be filtered by the following types:
- All: Lists all requests related to the network, including document requests, images, fonts, and CSS. Resources are placed in the order of them being loaded.
- Fetch/XHR: Lists XHR objects. This option lists dynamically loaded resources, such as API and AJAX content.
- JS: Lists JavaScript files involved in the request and response cycle.
- CSS: Lists all style files.
- Img: Lists image files and their details.
- Doc: Lists requested HTML or web-related documents.
- WS: Lists WebSocket-related entries and their details.
- Other: Lists any unfiltered type of request-related resources.
For each of the filter options just listed, there are some child tabs for selected resources in the Name panel, which are as follows:
- Headers: Loads HTTP/HTTPS header data for a particular request. A few important and automation-based types of data are also found, for example, request URL, method, status code, request/response headers, query string, payload, or POST information.
- Preview: Provides a preview of the response found, similar to the entities viewed in the web browser.
- Response: Loads the response from particular entities. This tab shows the HTML source for HTML pages, JavaScript code for JavaScript files, and JSON or CSV data for similar documents. It actually shows the raw source of the content.
- Initiator: Provides the initiator links or chains of initiator URLs. It is similar to the referer in the request headers.
- Timing: Shows a breakdown of the time between resource scheduling, when the connection starts, and the request/response.
- Cookies: Provides cookie-related information, its keys and values, and expiration dates.
Important note
The Network panel is one of the most important resource hubs. We can find/trace plenty of information and supporting details for each request/response cycle in this panel. For more detailed information on the Network panel, please visit https://developer.chrome.com/docs/devtools/network/ and https://firefox-source-docs.mozilla.org/devtools-user/network_monitor/.
- Performance: Screenshots and a memory timeline can be recorded. The visual information obtained is used to optimize the website speed, improve load times, and analyze the runtime or overall performance.
- Memory: Information obtained from this panel is used to fix memory issues and track down memory leaks. Overall, the details from the Performance and Memory panels allow developers to analyze website performance and embark on further planning related to optimization.
- Application: The end user can inspect and manage storage for all loaded resources during page loading. Information related to cookies, sessions, application cache, images, databases on the fly, and more can be viewed and even deleted to create a fresh session.
- Security: This panel might not be available in all web browsers. It normally shows security-related information, such as resources, certificates, and connections. We can even browse more about certificate details, from a few detail links or buttons available in this panel, as shown here in Figure 1.12:
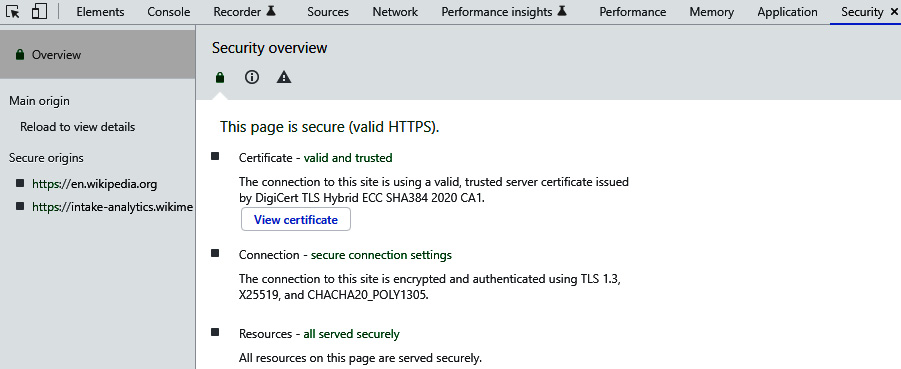
Figure 1.12: Security panel (details about certificate, connection, and resources)
After exploring the HTML page source and DevTools, we now have an idea about where data and request/response-related information is stored, and how we can access it. Overall, the scraping process involves extracting data from web pages, and we need to identify or locate the resources with data or those that can carry data. Before proceeding with data exploration and content identification, it is beneficial to identify the page URL, DevTools resources, XHR, JavaScript, and a general overview of browser-based activities.
Finally, there are more topics related to links, child pages, and more. We will be using techniques such as Sitemaps.xml and robots.txt in depth in Chapter 3.
Important note
For basic concepts related to sitemaps.xml and robots.txt, please visit the Sitemaps site (https://www.sitemaps.org) and the Robots Exclusion Protocol site (http://www.robotstxt.org).
In this chapter, you have learned about web scraping, selected web technologies that are involved, and how data-finding techniques are used.