Book Image

Learn D3.js

By : Helder da Rocha
2 (1)
Book Image

Learn D3.js

2 (1)
By: Helder da Rocha

Overview of this book

This book is a practical hands-on introduction to D3 (Data-driven Documents): the most popular open-source JavaScript library for creating interactive web-based data visualizations. Based entirely on open web standards, D3 provides an integrated collection of tools for efficiently binding data to graphical elements. If you have basic knowledge of HTML, CSS and JavaScript you can use D3.js to create beautiful interactive web-based data visualizations. D3 is not a charting library. It doesn’t contain any pre-defined chart types, but can be used to create whatever visual representations of data you can imagine. The goal of this book is to introduce D3 and provide a learning path so that you obtain a solid understanding of its fundamental concepts, learn to use most of its modules and functions, and gain enough experience to create your own D3 visualizations. You will learn how to create bar, line, pie and scatter charts, trees, dendograms, treemaps, circle packs, chord/ribbon diagrams, sankey diagrams, animated network diagrams, and maps using different geographical projections. Fundamental concepts are explained in each chapter and then applied to a larger example in step-by-step tutorials, complete with full code, from hundreds of examples you can download and run. This book covers D3 version 5 and is based on ES2015 JavaScript.
Table of Contents (13 chapters)

Histograms

Histograms are bar charts that are used to visualize distributions of numerical data. You can create a histogram if you have a dataset consisting of discrete samples of data in bins, or buckets, representing data intervals. The number of items in each bin represents the frequency, and is used for the bar height. The bar width is a fraction of the number of intervals.

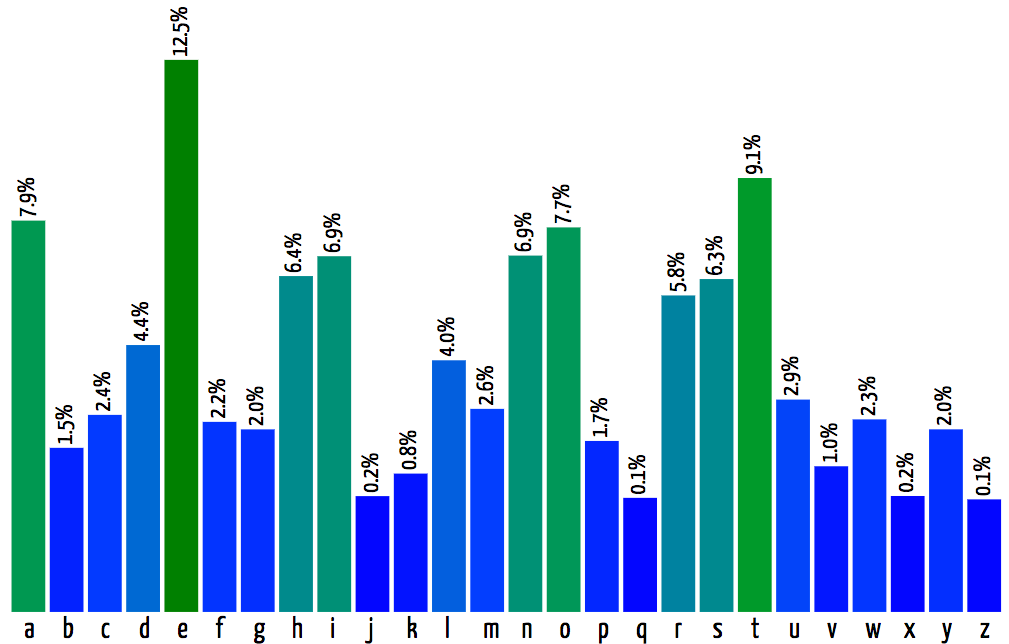
The following diagram contains 26 buckets, each one representing a letter of the English alphabet. The height of each bar represents the frequency of each letter in a sample of 26 million characters from the top 50 books published by Project Gutemberg in September 2018:

A diagram showing the relative frequency of the letters in the English language. Code: Examples/1-letter-histogram.html

The d3-array module also includes the d3.histogram() function, which is a histogram data generator. Calling this function...