

This recipe concentrates on a major and common widget for animations, known as the wijexpander. We will also see how to pass, handle, and manage live data via a Wijmo widget, which will in turn provide useful information to the users.
The wijexpander object works in a way that allows the user to expand a bar or region, which could be a div HTML element, and have visibility into embedded web content such as a web page like CNN. We will see how to use the wijexpander object to display embedded web content via a given URL. Copy or recreate the following code:
<html>
<head>
<!--jQuery References-->
<script src="http://ajax.aspnetcdn.com/ajax/jquery/jquery-1.7.1.min.js" type="text/javascript"></script>
<script src="http://ajax.aspnetcdn.com/ajax/jquery.ui/1.8.17/jquery-ui.min.js" type="text/javascript"></script>
<!--Wijmo Widgets JavaScript-->
<script src="http://cdn.wijmo.com/jquery.wijmo-open.all.2.0.0.min.js" type="text/javascript"></script>
<script src="http://cdn.wijmo.com/jquery.wijmo-complete.all.2.0.0.min.js" type="text/javascript"></script>
<!--Theme-->
<link href="http://cdn.wijmo.com/themes/rocket/jquery-wijmo.css" rel="stylesheet" type="text/css" title="rocket-jqueryui" />
<!--Wijmo Widgets CSS-->
<link href="http://cdn.wijmo.com/jquery.wijmo-complete.all.2.0.0.min.css" rel="stylesheet" type="text/css" />
<style type="text/css">
    #my-wij-expander
    {
        width: 550px;
    }
    #webpage-content{
      height: 350px;
    }
</style>

</head>
<body>
<div id="my-wij-expander">
    <h3>cnn.com</h3>
    <div id="webpage-content"></div>
</div>

<script id="scriptInit" type="text/javascript">
    $(document).ready(function () {
        $("#my-wij-expander").wijexpander({
            contentUrl: "http://www.cnn.com",
            expandDirection: "top" //This expands the element
        });
    });
</script>
</html>First of all, we reference all the requisite code we need to run Wijmo.
Next, we create a
divtag where the referenced URL content from CNN will be embedded.Then, we create a script that instantiates a
wijexpanderwidget by applying the necessary configurations for our expected expansion behavior and referencing the URL with which we intend to display its content.Lastly, we add some basic styling to our content areas. If the code runs successfully, we should have a
wijexpanderobject similar to the following screenshot:
Clicking on the expansion arrow will collapse the gray
divarea, thereby revealing the hidden URL content (CNN in this case) as follows:
Here are a few other common options or configurations that would help you further customize your wijexpander widget:
disabled: This option determines whether to disable or enable the behavior of the widget. If set tofalse, the widget becomes enabled. An example is shown as follows:$("#myPrivateElement").wijexpander({ disabled: true });expandDirection: This option determines the direction that the content will expand to, as used in the preceding code. The available options for this property aretop,left,right, andbottom. An example is shown as follows:$("#my-wij-expander").wijexpander({ expandDirection: "left" });
Wijmo expanders also have events and callbacks that are activated before and/or after certain events. For more information on wijexpander widgets, visit the following link:
http://wijmo.com/wiki/index.php/Expander
Wijmo has claimed that all their charts have been optimized to support live data streaming. Data routinely gets fed into the widgets at any given frequency. This data automatically and continually recalculates and, subsequently, redraws the chart to convey useful desired information to the user. We will illustrate this using a Wijmo line chart, which displays information as a series of data points connected by straight point segments.
Enter the following code into your favorite code editor:
<html>
<head>
<!--jQuery References-->
<script src="http://ajax.aspnetcdn.com/ajax/jquery/jquery-1.7.1.min.js" type="text/javascript"></script>
<script src="http://ajax.aspnetcdn.com/ajax/jquery.ui/1.8.17/jquery-ui.min.js" type="text/javascript"></script>
<!--Wijmo Widgets JavaScript-->
<script src="http://cdn.wijmo.com/jquery.wijmo-open.all.2.0.0.min.js" type="text/javascript"></script>
<script src="http://cdn.wijmo.com/jquery.wijmo-complete.all.2.0.0.min.js" type="text/javascript"></script>
<!--Theme-->
<link href="http://cdn.wijmo.com/themes/rocket/jquery-wijmo.css" rel="stylesheet" type="text/css" title="rocket-jqueryui" />
<!--Wijmo Widgets CSS-->
<link href="http://cdn.wijmo.com/jquery.wijmo-complete.all.2.0.0.min.css" rel="stylesheet" type="text/css" />
<script id="scriptInit" type="text/javascript">
        var myX = [], myY = [];
        var randomValuesCount = 10;
        var duration = 3000;
        var dx = 0;
        var intervalRandomData = null;

        $(document).ready(function () {
            for (dx = 0; dx < randomValuesCount; dx++) {
                myX.push(dx);
//random Y data points
                myY.push(createRandomValue());
            }
      //Instantiating the wijlinechart on #wijlinechart
            $("#wijlinechart").wijlinechart({
                showChartLabels: false,
                width: 700,
                height: 425,
                shadow: false,
                animation: {
                    enabled: false
                },
                seriesTransition: {
                    enabled: false
                },
                legend: { visible: false },
                hint: { enable: false },
                header: { text: "Wijmo Live Data Simulation" },
                axis:
                {
                    y: { min: 0, max: 100, autoMin:false, autoMax: false }
                },
//creating the data points for the chart
                seriesList: [
                    {
                        data: {
                            x: myX,
                            y: myY
                        },
                        markers: {
                            visible: true,
                            type: "circle"
                        }
                    }
                ],
                seriesStyles: [{ "stroke-width": 3, stroke: "#00a6dd"}],
                seriesHoverStyles: [{ "stroke-width": 4}]

            });

            doAnimate();

            intervalRandomData = setInterval(function () {
                $("#wijlinechart").wijlinechart("addSeriesPoint", 0, { x: dx++, y: createRandomValue() }, true); //keep adding points to the series
                doAnimate();
            }, duration);
        });

        function doAnimate() {
            var path = $("#wijlinechart").wijlinechart("getLinePath", 0), //handle to the path
                markers = $("#wijlinechart").wijlinechart("getLineMarkers", 0), //handle to the markers
                box = path.getBBox(),
                width = $("#wijlinechart").wijlinechart("option", "width") / 10,
                anim = Raphael.animation({transform: Raphael.format("...t{0},0", -width)}, duration); //how we want to animate. The animation mechanism is referenced by variable anim.
            path.animate(anim); //animate the path using anim.
            if (path.shadow) {
                var pathShadow = path.shadow;
                pathShadow.animate(anim);
            }
            markers.animate(anim); //without this line, the markers will not animate or move along with the path. We also want to animate the markers using anim.
          var rect = box.x + " " + (box.y - 5) + " " + box.width + " " + (box.height + 10); //Comment A
            path.wijAttr("clip-rect", rect); //Comment B
            markers.attr("clip-rect", rect); //Comment C
            //Comments A, B, and C code lines prevent the line chart animation from going outside the chart.
        }

        function createRandomValue() {
            var val = Math.round(Math.random() * 100);
            return val;
        }

    </script>
    </head>
    <body>
    <div>
        <div>
            <h2>Streaming Live Random Data</h2>
        </div>
        <div class="main">
            <div id="wijlinechart"></div>
            <div class="demo-options"></div>
        </div>
        <div class="footer">
            <p>
        This demo simulates streaming live randomized data using the <u>getLinePath</u> and <u>getLineMarkers</u> methods.
            </p>
        </div>
    </div>
</body>
</html>
If the preceding code runs successfully, we should have an animated chart that looks like this:
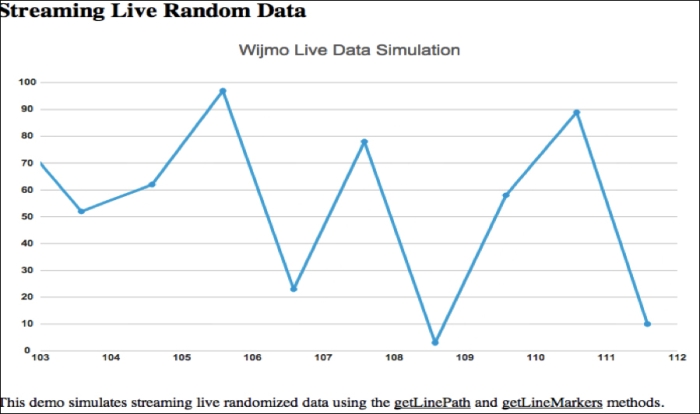
The preceding code that generated this animation is properly commented to give reasons as to why certain lines were coded the way they were. In a nutshell, anyone could customize the code to stream live data from a server or a constantly-fed spreadsheet or XML data, using the JavaScript calls within certain timed intervals. The JavaScript function setInterval() is also pretty helpful in achieving this.
Note
The preceding code is similar to the one found at http://wijmo.com/demo/explore/?widget=LineChart&sample=Streaming%20data.