
So far, you have learned how to add tile layers to a map. In the previous example, you added a WMS layer on top of a base tile layer. Now, you will learn how to draw your own layers that need to be added on top of a tile layer. The three geometric primitives of vector data that you can add to a map are often referred to as points, lines, and polygons.
In this section, you will learn how to add markers, polylines, and polygons to your map.
So far, your map is not that interesting. You often draw a map to highlight a specific place or point. Leaflet has a Point class; however, it is not used to simply add a point on the map with an icon to specify the place. In Leaflet, points are added to the map using the Marker class. At minimum, the Marker class requires a latitude and longitude, as shown in the following code:
Var myMarker = L.marker([35.10418, -106.62987]).addTo(map);
Note
You can create a marker by simply calling L.marker([lat,long]).addTo(map);, but assigning the marker to a variable will allow you to interact with it by name. How do you delete a specific marker if it does not have a name?
In the preceding code, you created a marker at point [35.10418, -106.62987], and then, as with the tile layer, you used the addTo(map) function. This created a marker icon at the specified latitude and longitude. The following screenshot shows the marker on the map:
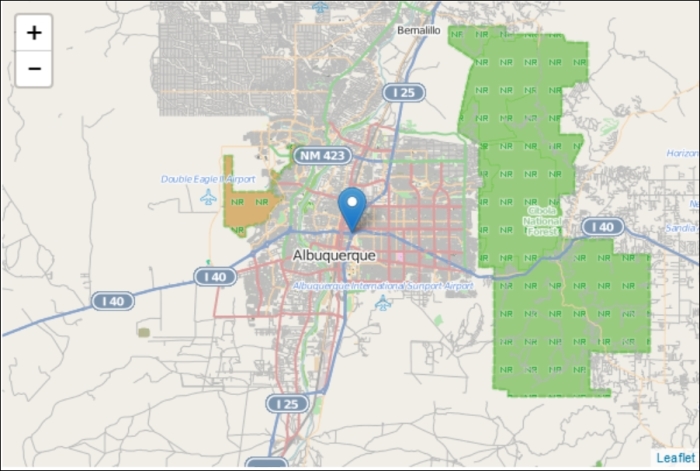
The preceding example is a simplified, and almost useless, marker. The Marker class has options, events, and methods that you can call to make them more interactive and useful. You will learn about methods—specifically the bindPopup() method— and events later in this chapter.
There are 10 options you can specify when creating a marker, as follows:
iconclickabledraggablekeyboardtitlealtzIndexOffsetopacityriseOnHoverriseOffset
The
options clickable, draggable, keyboard, zIndexOffset, opacity, riseOnHover, and riseOffset are all set to a default value. In Chapter 4, Creating Custom Markers, you will learn about the icon option in detail. Two options that you should set are title and alt. The title option is the tooltip text that will be displayed when you hover over the point with the cursor, and the alt option is the alternative text that is read using screen readers for accessibility. These options are used in the following code:
varmyMarker = L.marker([35.10418, -106.62987],
{title:"MyPoint",alt:"The Big I",draggable:true}).addTo(map);
The code extends the original marker example by adding a title and alt text and making the marker draggable. You will use the draggable options with an event in the last section of this chapter. The options are set the same as when we created our map instance; use curly braces to group the options, and separate each option with a comma. This is how options will be set for all objects.
The first vector layer you will learn to create is aLine. In Leaflet, you will use the Polyline class. A polyline can represent a single line segment or a line with multiple segments. Polylines and polygons extend the path class. You do not call path directly, but you have access to its methods, properties, and events. To draw a polyline, you need to provide at least a single longitude and latitude pair. The option for a polyline is set as default, so you need not specify any values unless you want to override the default. This is shown in the following code:
var polyline = L.polyline([[35.10418, -106.62987],[35.19738, -106.875]], {color: 'red',weight:8}).addTo(map);In this example, the polyline is red and has a weight of 8. The weight option defaults to 5. If you want a thicker line, increase the number. For a thinner line, decrease the number. To add more segments to the line, just add additional latitude and longitude values as shown in the following code:
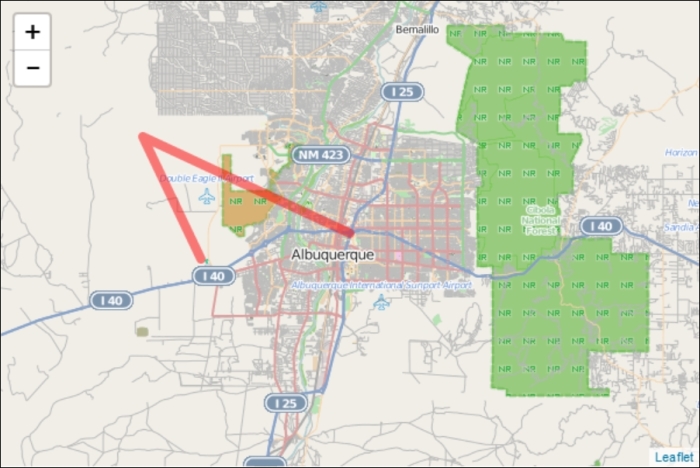
var polyline = L.polyline([[35.10418, -106.62987],[35.19738, -106.875],[35.07946, -106.80634]], {color: 'red',weight:8}).addTo(map);Note
You need to first provide a latitude and longitude pair because a line consists of at least two points. Afterwards, you can declare additional latitudes and longitudes to extend your line.
The following screenshot shows the polyline added to the map:
A polygon is a polyline that is closed. Polygons tend to be classified by the number of sides, as follows:
Triangle (3)
Hexagon (6)
Octagon (8)
Leaflet has a class for drawing two common polygons: a circle and a rectangle. When drawing a polygon, you will specify a minimum of three coordinates. A triangle is the simplest polygon that you can draw. That is why you need to provide at least three points. You do not need to specify the starting point at the end of the list. Leaflet will automatically close the polygon for you. To draw a polygon, simply copy the code for the polyline with three points and change the class to L.polygon(), as shown in the following code:
var polygon = L.polygon([[35.10418, -106.62987],[35.19738, -106.875],[35.07946, -106.80634]], {color: 'red',weight:8}).addTo(map);Since Leaflet automatically closes the polygon, our three-point polyline can become a polygon. Since polyline and polygon inherit from path, the options color and weight apply to both. You will notice that color and weight refer to the outline of the polygon. Two options that you will find useful when drawing polygons are fillColor and fillOpacity:
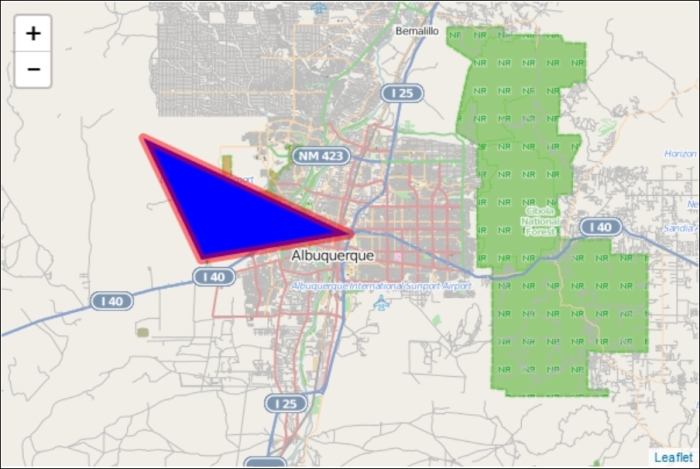
var polygon = L.polygon([[35.10418, -106.62987],[35.19738, -106.875],[35.07946, -106.80634]], {color: 'red',weight:8,fillColor:'blue',fillOpacity:1}).addTo(map);The preceding code draws a red triangle with a weight of 8. The additional options of fillColor and fillOpacity are set to blue and 1. The fill color of a polygon will be set to the default if no fillColor option is selected. You only need to use fillColor if you want a different fill color than the outline.
The following screenshot shows the red triangle with a blue fill added to the map: