

When deploying any application by right-clicking on the project and selecting Run, the HTTP monitor pops up at the bottom of the NetBeans main window.
The HTTP monitor allows us to easily see request parameters and attributes, as well as cookies, session attributes, context (application) attributes, information about the client (browser) and server, as well as request headers.
Expanding the node labeled Current Records on the left pane of the HTTP monitor, then clicking on one of its child nodes, results in the right pane displaying information about the selected record.
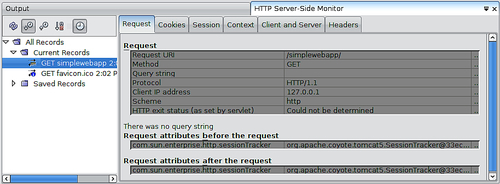
At a glance we can see a lot of information such as the request URI, HTTP method, query string, etc. Notice that we can see an object stored as a request attribute. This request attribute is set behind the scenes by GlassFish, which is the application server we are using to deploy our application.
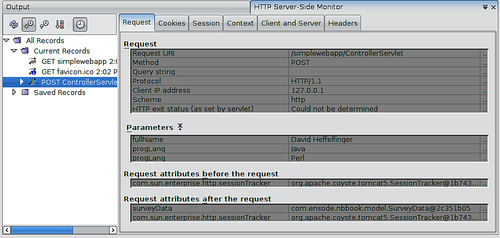
Notice that now we can see some additional information, the name and values...