Book Image

Java EE 5 Development with NetBeans 6

Book Image

Java EE 5 Development with NetBeans 6

Overview of this book

Table of Contents (17 chapters)
Java EE 5 Development with NetBeans 6
Credits
About the Author
About the Reviewers
Preface
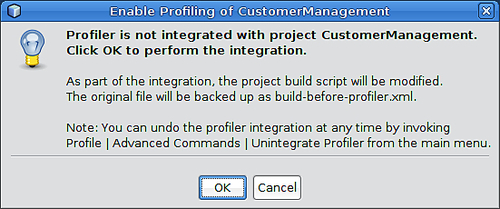
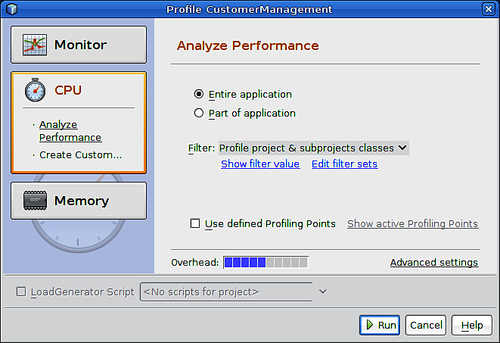
Identifying Performance Issues with NetBeans Profiler

Profiling Our Application


All we need to do in order to profile our application is right-click on it in the Projects window and select Profile.

Before we can profile an application, we need to calibrate the NetBeans profiler by going to Profile | Advanced Commands | Run Profiler Calibration.

The first time we attempt to profile our application, the following dialog will pop-up:

After clicking OK, NetBeans will make some changes to the project's build script to allow profiling our application, then the following dialog will pop-up:

As we can see, there are several aspects of our application we can profile, such as memory allocation and CPU usage. One of the most useful features of the NetBeans profiler is the ability to report how long each method invocation in our application is taking. This information is provided when we profile CPU usage.

In order to start profiling, we simply click on the Run button. At this point the application server will start in profiling mode, and our application will be deployed and executed. After a few seconds the Profiler control panel will open.

We can see how long each method is taking and how many times each method has been executed by simply clicking on the Live Results button.

The Live Profiling Results window displays every method invocation, with the percentage of total time in the application that the method is using, the number of milliseconds the method takes to complete. It also shows how many times each method has been invoked.

As we can see, the NetBeans profiler can be very helpful in pinpointing areas of our application that are having performance problems, allowing us to easily identify these areas so that we can better focus our performance optimization efforts.

At this point we can take a snapshot so that we can compare performance of the application after we modify it in the future. We can take a snapshot by simply clicking on the icon labeled Take Snapshot in the Profiler window.

Taking a snapshot will result in a new tab being opened, displaying exactly the same information we saw in the Live Profiling Results window. We can save the snapshot by simply going to File | Save, or by using the usual keyboard shortcut, just like we save any other file.

At this point we will see our snapshot listed in the Saved Snapshots section of the Profiler window.

Although knowing how long each method in our application is taking to complete is very valuable information, it is by no means the only information we can obtain from the NetBeans profiler. We can see how much memory our application is using by simply opening the VM Telemetry Overview window by clicking on the icon on the Profiling control panel.

The graph on the left shows (in red) the total amount of heap allocated in our application's Java Virtual Machine, additionally, it shows the total amount of heap used by our application (in purple).

The graph in the middle is useful for detecting "memory leaks". (Java has garbage collection, therefore, in theory, memory leaks are impossible, however if we keep references to objects that are no longer needed, they are never garbage collected, therefore in practice a memory leak is possible.) The purple line in the middle graph indicates the amount of time the JVM spends doing garbage collection. The red line indicates "Surviving Generations". A generation is a set of objects that were created within two garbage collection intervals. A "Surviving Generation" is a generation that survived one or more garbage collections. We can force our application to garbage collect by clicking on the icon in the Profiling control panel. If the graph indicates a high number of surviving generations between garbage collections, we might have a memory leak in our application.

The graph on the right of the VM Telemetry Overview window indicates the number of active threads and the number of loaded classes in our application.