Book Image

IBM Cognos 8 Report Studio Cookbook

By : Abhishek Sanghani
Book Image

IBM Cognos 8 Report Studio Cookbook

By: Abhishek Sanghani

Overview of this book

Cognos Report Studio is widely used for creating and managing business reports in medium to large companies. It is simple enough for any business analyst, power user, or developer to pick up and start developing basic reports. However, when it comes to developing more sophisticated, fully functional business reports for wider audiences, report authors will need guidance. This book helps you understand and use all the features provided by Report Studio to generate impressive deliverables. It will take you from being a beginner to a professional report author. It bridges the gap between basic training provided by manuals or trainers and the practical techniques learned over years of practice. This book covers all the basic and advanced features of Report Authoring. It begins by bringing readers on the same platform and introducing the fundamental features useful across any level of reporting. Then it ascends to advanced techniques and tricks to overcome Studio limitations.Develop excellent reports using dimensional data sources by following best practices that development work requires in Report Studio. You will also learn about editing the report outside the Studio by directly editing the XML specifications. Provide richness to the user interface by adding JavaScript and HTML tags. The main focus is on the practical use of various powerful features that Report Studio has to offer to suit your business requirements.
Table of Contents (18 chapters)
IBM Cognos 8 Report Studio Cookbook
Credits
About the Author
About the Reviewers
Preface
Index

Aggregation versus pre-aggregated values


The biggest advantage of using a cube as data source is its capability to pre-aggregate values. This recipe will show you how to exploit this feature of cube in your Cognos reports.

Getting ready

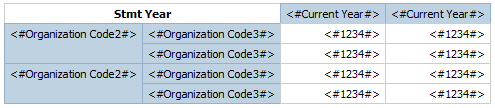
Create a simple crosstab report using GO Sales SSAS Cube package. Pull Organization Code2 and Code3 on rows, and Current Year on columns. Drag Stmt Year in the intersection.

How to do it...

  1. First, we will create aggregation using standard method. For that, select the Organization Code3 row.

  2. From the toolbar, click on the Aggregate button and choose Aggregate.

  3. Run the report to test it.

  4. Now go back to the Report Studio. Delete the new row created for Aggregation.

  5. Go to second tab (Data Item) of Insertable objects. Drag Organization Code2 again on report and drop it under Organization Code3 and format this row to be bold; shown as follows:

  6. Now run the report to test it.

  7. Notice that the aggregated values are the same.

How it works...

The first method that we used to create...