Book Image

IBM Cognos 8 Report Studio Cookbook

By : Abhishek Sanghani
Book Image

IBM Cognos 8 Report Studio Cookbook

By: Abhishek Sanghani

Overview of this book

Cognos Report Studio is widely used for creating and managing business reports in medium to large companies. It is simple enough for any business analyst, power user, or developer to pick up and start developing basic reports. However, when it comes to developing more sophisticated, fully functional business reports for wider audiences, report authors will need guidance. This book helps you understand and use all the features provided by Report Studio to generate impressive deliverables. It will take you from being a beginner to a professional report author. It bridges the gap between basic training provided by manuals or trainers and the practical techniques learned over years of practice. This book covers all the basic and advanced features of Report Authoring. It begins by bringing readers on the same platform and introducing the fundamental features useful across any level of reporting. Then it ascends to advanced techniques and tricks to overcome Studio limitations.Develop excellent reports using dimensional data sources by following best practices that development work requires in Report Studio. You will also learn about editing the report outside the Studio by directly editing the XML specifications. Provide richness to the user interface by adding JavaScript and HTML tags. The main focus is on the practical use of various powerful features that Report Studio has to offer to suit your business requirements.
Table of Contents (18 chapters)
IBM Cognos 8 Report Studio Cookbook
Credits
About the Author
About the Reviewers
Preface
Index

List report or crosstab report


This recipe shows that most of the times it is possible to use a crosstab report instead of a list report, and then discusses the pros and cons of each.

Getting ready

We will use the "GO Data Warehouse (analysis)" package for this.

How to do it...

  1. Create a new List type of report based on this package.

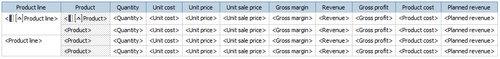
  2. Drag columns on the list shown as follows. Create grouping and sorting for Product line and Product.

  3. Run the report to test it.

  4. Now save this report and create a new report of 'Crosstab' type.

  5. Drag items on the crosstab shown as follows. Define sorting on Product line and Product.

  6. Run the report to test it.

How it works...

You will see that both reports bring the same data back. It is a general practice to use lists for relational models whereas crosstabs for dimensional models. I believe this practice comes from the fact that multidimensional databases (cubes) are accessed using MDX that naturally returns the data in two axes.

However, the biggest factors that drive the...