Book Image

Hands-On G Suite for Administrators

By : Cesar Anton Dorantes
Book Image

Hands-On G Suite for Administrators

By: Cesar Anton Dorantes

Overview of this book

Hands-On G Suite for Administrators is a comprehensive hands-on guide to G Suite Administration that will prepare you with all you need to know to become a certified G Suite Administrator, ready to handle all the business scales, from a small office to a large enterprise. You will start by learning the main features, tools, and services from G Suite for Business and then, you will explore all it has to offer and the best practices, so you can make the most out of it. We will explore G Suite tools in depth so you and your team get everything you need -combination of tools, settings and practices- to succeed in an intuitive, safe and collaborative way. While learning G Suite tools you will also learn how to use Google Sites and App Maker, to create from your corporate site to internal tools, live reports that seamlessly integrate with live documents, and advanced Google Services. Finally, you will learn how to set up, analyze and enforce Security, Privacy for your business and how to efficiently troubleshoot a wide variety of issues.
Table of Contents (15 chapters)
Free Chapter
1
Section 1: G Suite for Business
6
Section 2: G Suite with Google Domains
10
Section 3: Security, Privacy, and Troubleshooting
12
Section 4: Apps and Sites

Understanding the Users report

The Users report gives administrators the ability to focus on a particular user or a particular activity, as well as to compare users by selecting different metrics and filters.

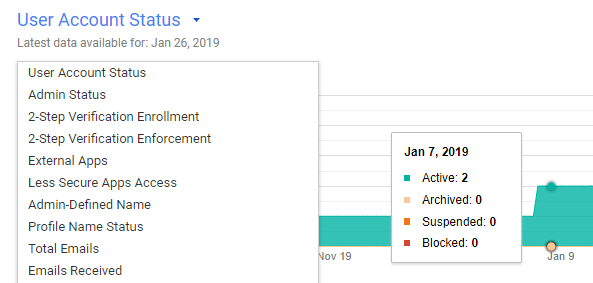
Above the account activity report, you will see a dynamic timeline that shows your users' activity through time; this can give you many insights into your team's activities. Click on the name of the metric to see a list with all the available options:

Below the timeline, you will see a dynamic table with aggregate information that will allow you to easily compare your users:

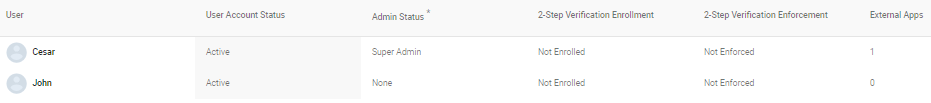
If you click on a column name, the chart will show the timeline for that metric, and you can select the columns on display by clicking on the Select columns icon (the icon that looks like three gray lines) and choosing the metrics you are looking for.

Since there are so many metrics that...