
Monitoring Adoption and Usage
In order for your organization to get the most benefit from a Microsoft 365 investment, it’s important that users adopt the services and features. You can monitor end user adoption and consumption metrics through a variety of tools, including Microsoft 365 usage metrics, Viva Insights (formerly known as Workplace Analytics), and the Adoption Score (formerly known as the Productivity Score).
Microsoft 365 Usage Reports
The Microsoft 365 usage reports are available inside the Microsoft 365 admin center. They are broad reports that can be used to get a high-level snapshot of how your organization is using the Microsoft 365 platform. Report data includes statistics such as how many files are stored in SharePoint, how many Exchange mailboxes were active during the reporting period, and engagement with other products such as Viva Engage (formerly Yammer) or Forms.
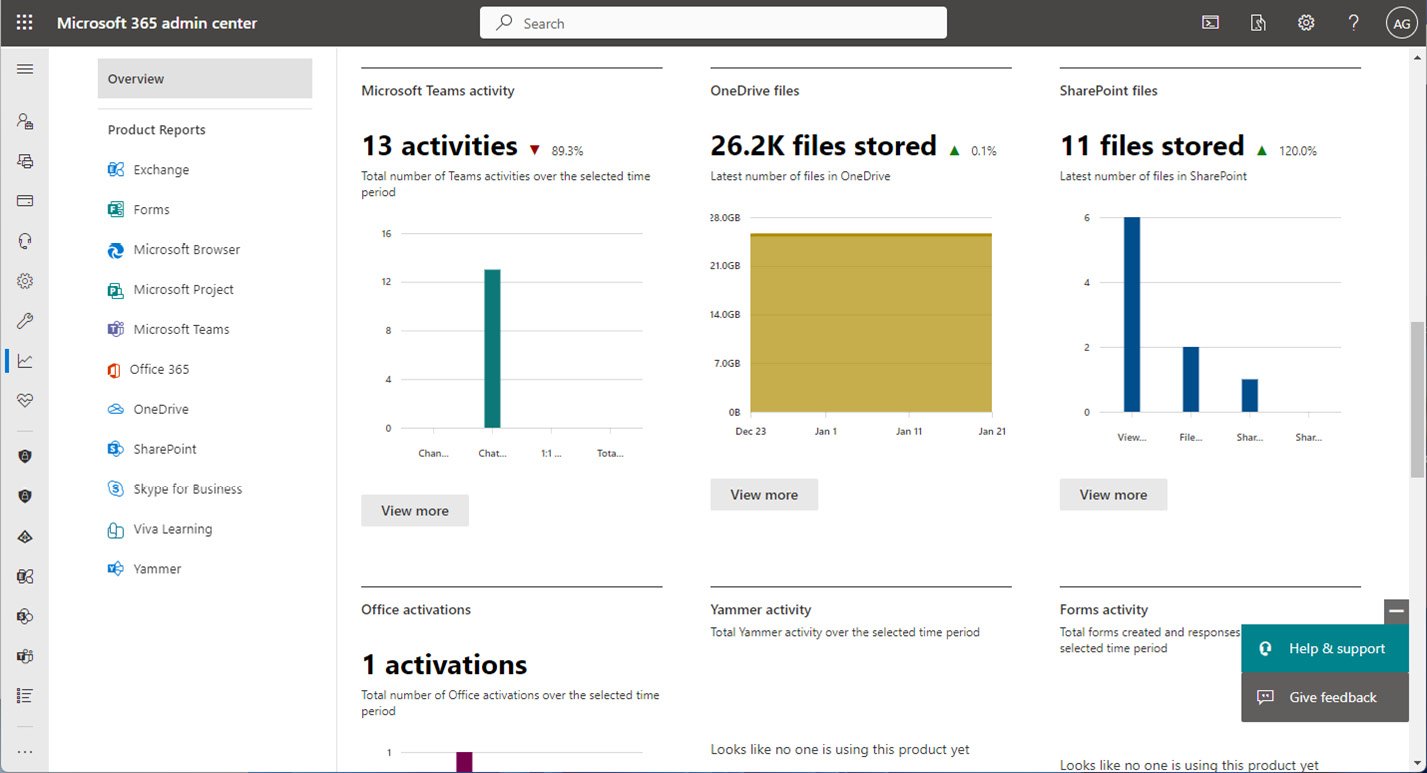
Figure 1.23 – Microsoft 365 usage reports
Usage reports can be accessed by navigating to the Microsoft 365 admin center (https://admin.microsoft.com), expanding Reports, and selecting Usage.
Viva Insights
Formerly known as Workplace Analytics, Viva Insights provides recommendations about personal and teamwork habits. Viva Insights has four core areas:
- Personal insights
- Teamwork habits
- Organization trends
- Advanced insights
Each of these areas has unique features that are part of the Viva story.
Personal Insights
As the name suggests, personal insights are tailored to an individual. Personal insights are private and are only visible to the individual for whom they are intended. Personal insights are best viewed using the Viva Insights app in Microsoft Teams, as shown in Figure 1.24:
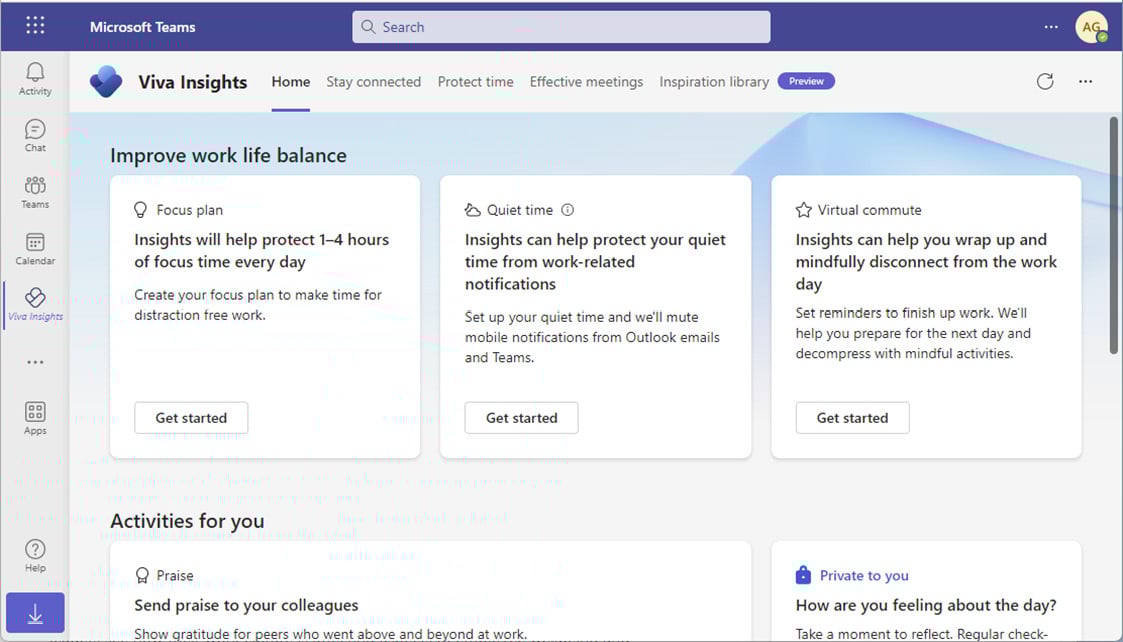
Figure 1.24 – Viva Insights app in Microsoft Teams
The Viva Insights app has functions to allow you to make a focus plan (sometimes referred to as the protect time feature), send praise to your colleagues either publicly or privately, and stay connected through AI-based task suggestions and meeting assistance.
The Viva Insights app also features Headspace guided meditation and mindfulness exercises as well as prompts to take a break and reflect on your personal feelings. Using the reflection activity card, you can even set daily reminders to check in with yourself. See Figure 1.25:
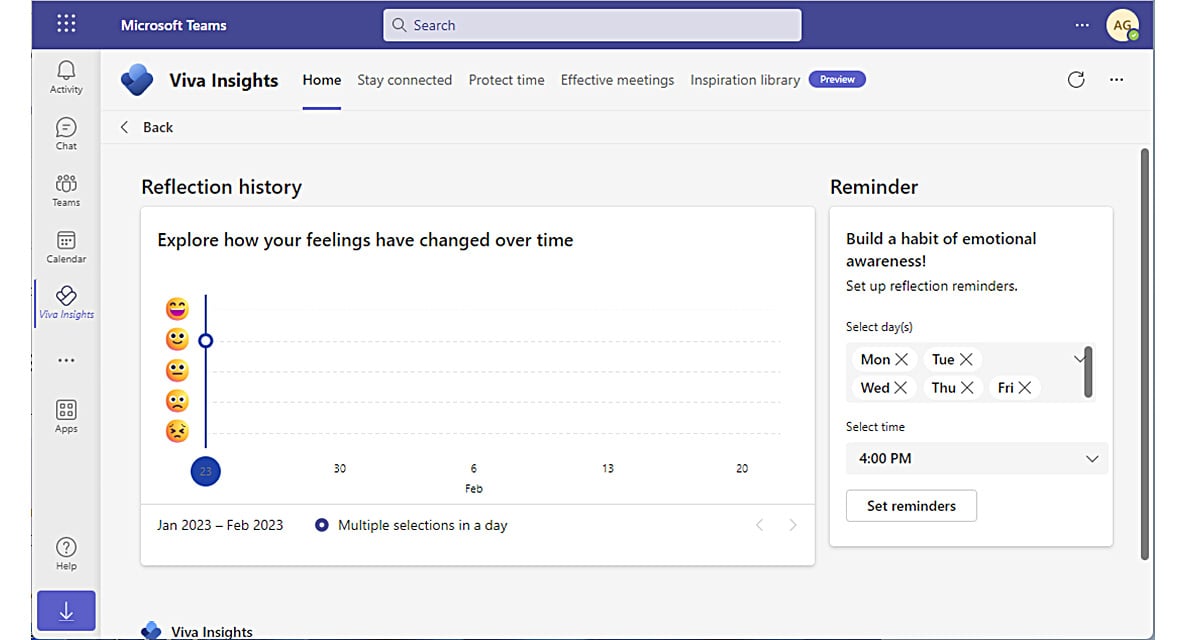
Figure 1.25 – Reflection activity card
Viva Insights also has a daily ramp-up and wind-down micro-app called Virtual Commute, which lets users review upcoming meetings and tasks, block focus time, and initiate a variety of mini-break, meditative, and reflective activities. See Figure 1.26:
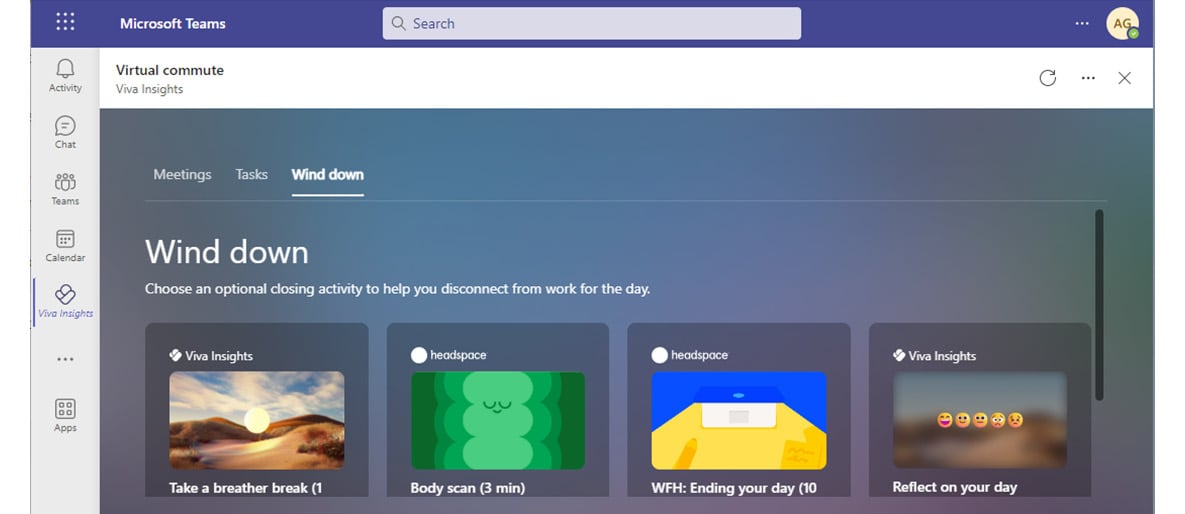
Figure 1.26 – Virtual commute activity card
Together, these insight features can help users manage both their productivity and personal well-being.
Teamwork Habits
Viva Insights Teamwork habits, which is part of the premium Viva Insights experience, allows managers to gain additional recommendations for managing people. Teamwork habits helps managers identify regular after-hours work, meeting overload conditions, and lack of dedicated focus time.
Managers can set up teams by manually adding users, or can use the suggested list if the manager property has been populated in Azure Active Directory. See Figure 1.27:
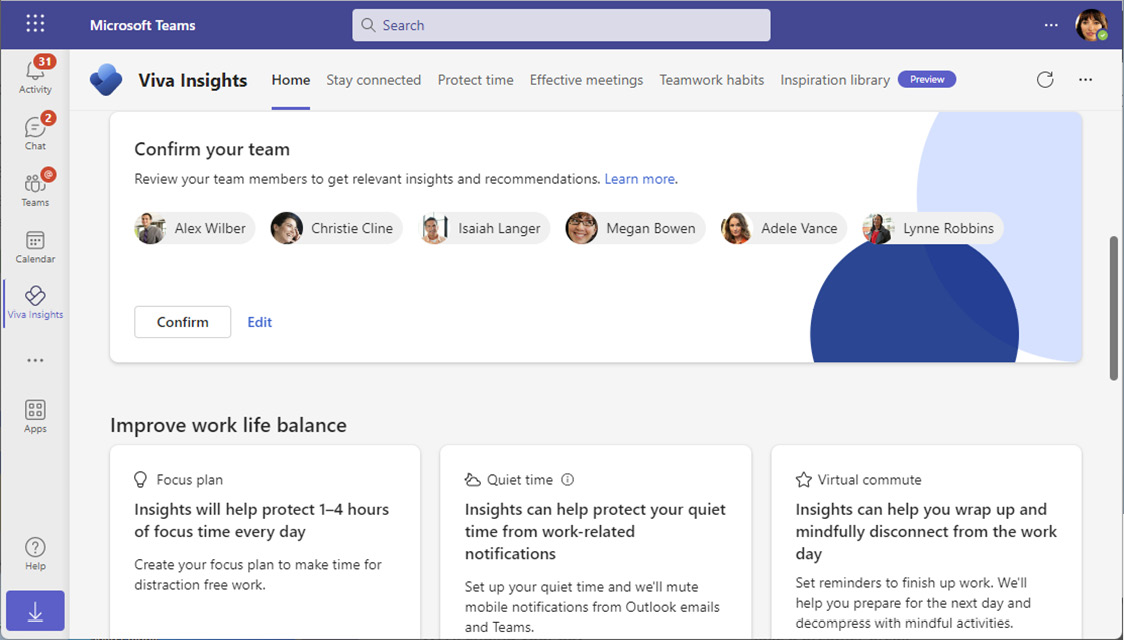
Figure 1.27 – Confirming team members
Three additional core features of Teamwork habits are the following:
- Scheduling recurring 1:1 times with managed employees
- Analyzing quiet hours impact to determine how work habits impact employees outside of their configured working hours
- Configuring shared plans for no-meeting days and shared focus times
Organizations that utilize the Teamwork habits tools can improve their employees’ well-being and work-life balance. The Teamwork habits feature requires a premium Microsoft Viva Insights license.
Organization Trends
The My organization tab shows organization trends as well as business leader and manager insights to help understand how to effectively manage your teams. Insights include such as identifying work patterns and suggestions for boosting employee engagement. See Figure 1.28:
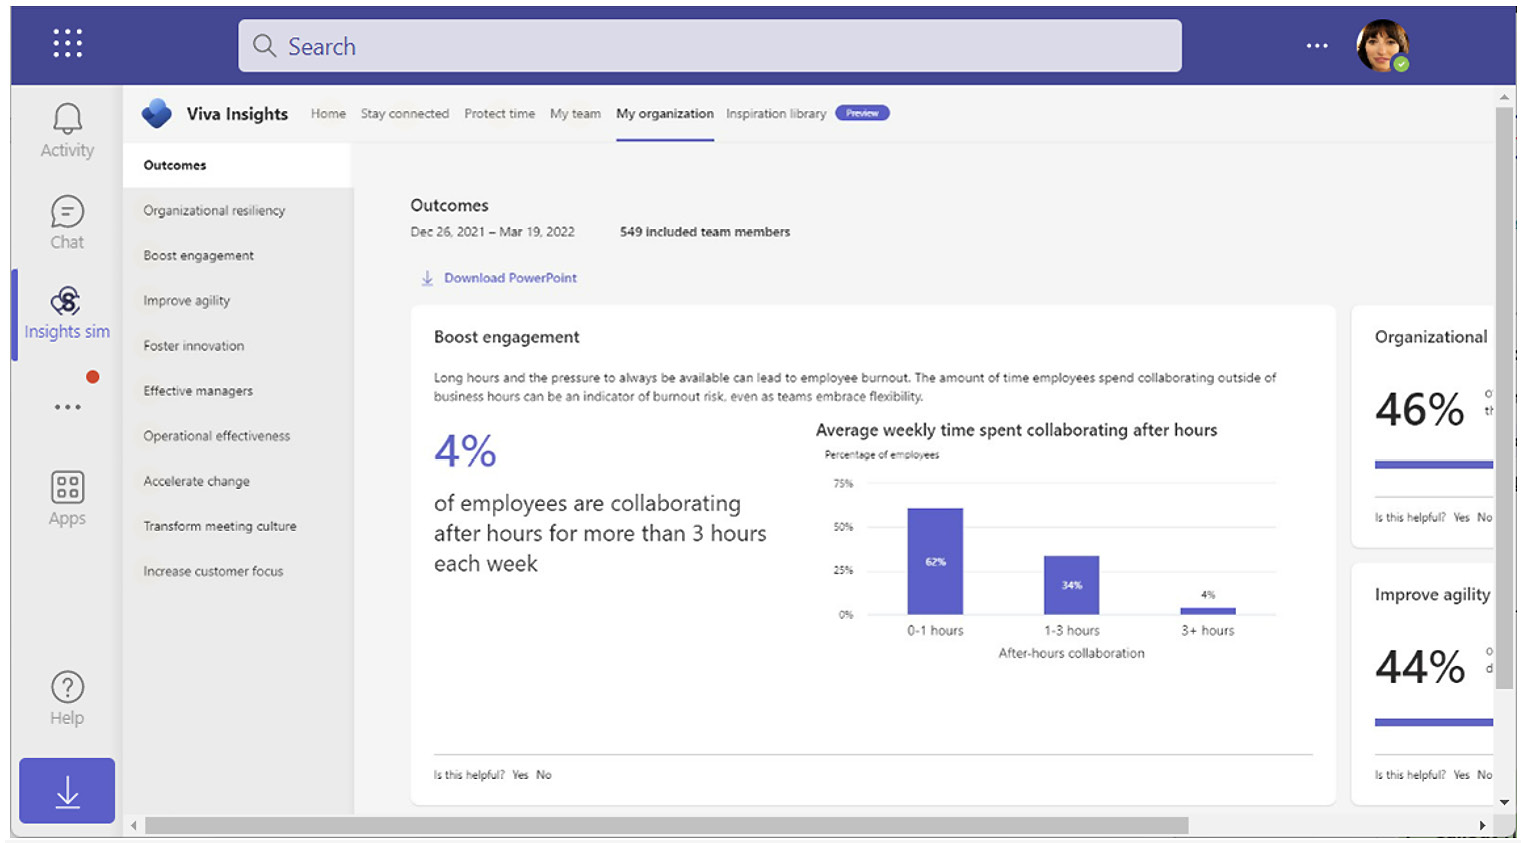
Figure 1.28 – Organization trends
Organization trends data is privacy-oriented, requiring a minimum of 10 people (including the manager) to be in the management chain, either directly or indirectly. In addition, access to Organization trends requires granting access to manager insights through the Viva setup.
Advanced Insights
Microsoft Viva advanced insights is a reporting tool that provides research-based behavioral insights into organizational work patterns, such as hybrid work, work-life balance, and employee well-being.
The advanced insights reporting tools come with a number of built-in templates and analysis tools to really help organizations understand everything from meeting effectiveness to employee performance trends correlated to 1:1 manager meetings. The Manager coaching report, which is part of Viva Insights, is shown in Figure 1.29:
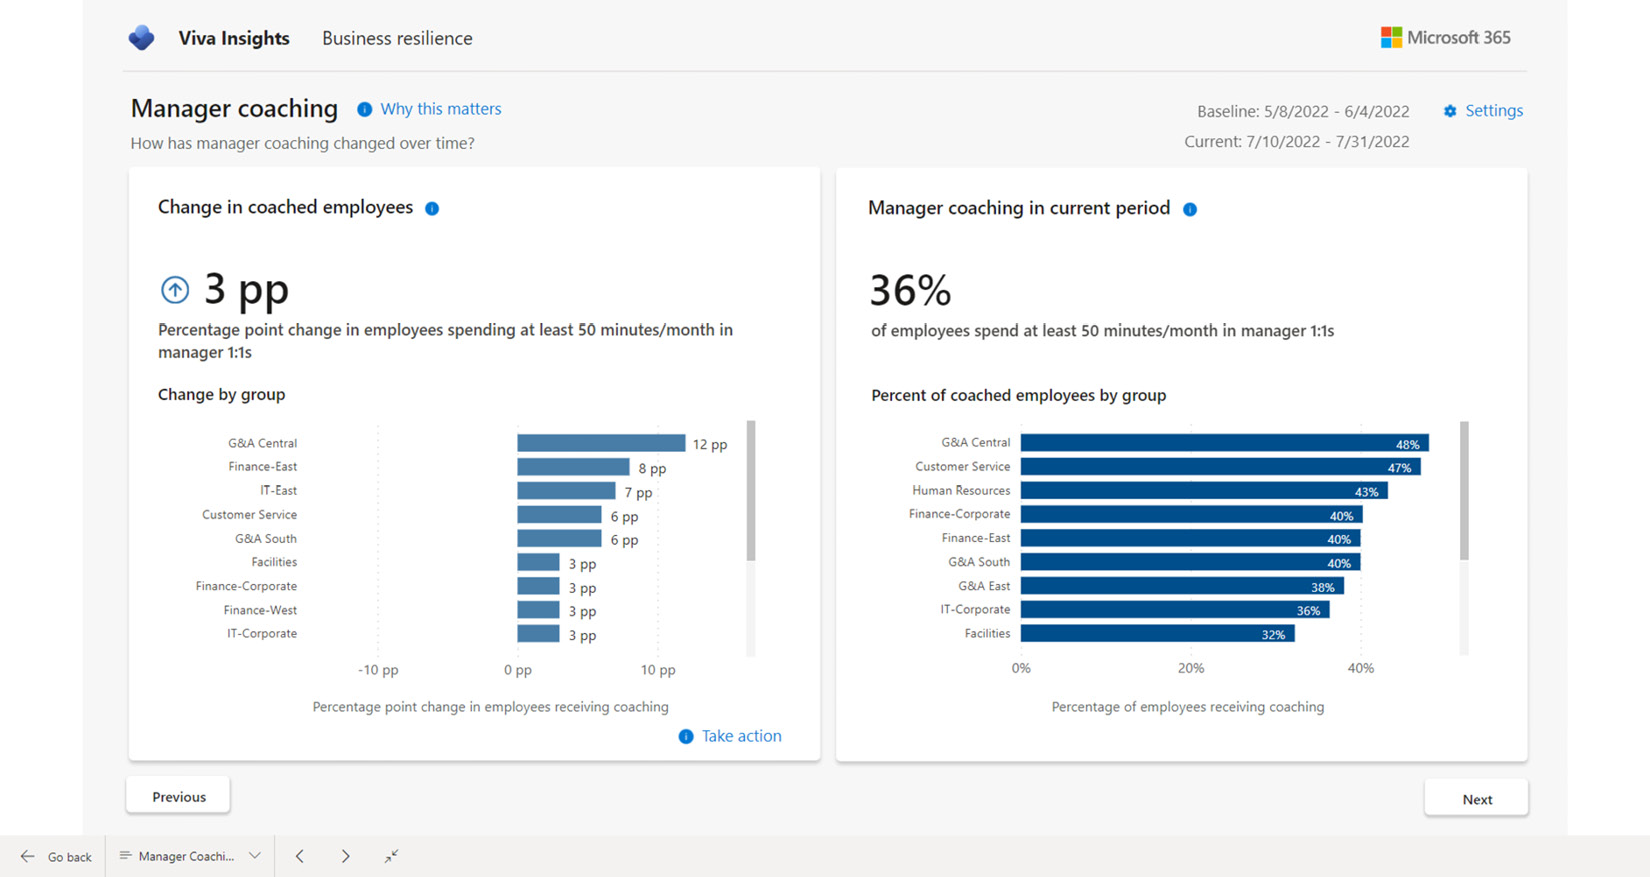
Figure 1.29 – Viva Insights Manager coaching report
With large organizational changes such as hybrid and remote work scenarios, it can be important to understand how those work patterns affect performance, including interesting data points such as how much time is spent during meetings multitasking or how much work is getting done outside normal business hours.
Information about working hours is available in the Work-life balance and flex work report (part of the Hybrid workforce experience reporting section), shown in Figure 1.30:
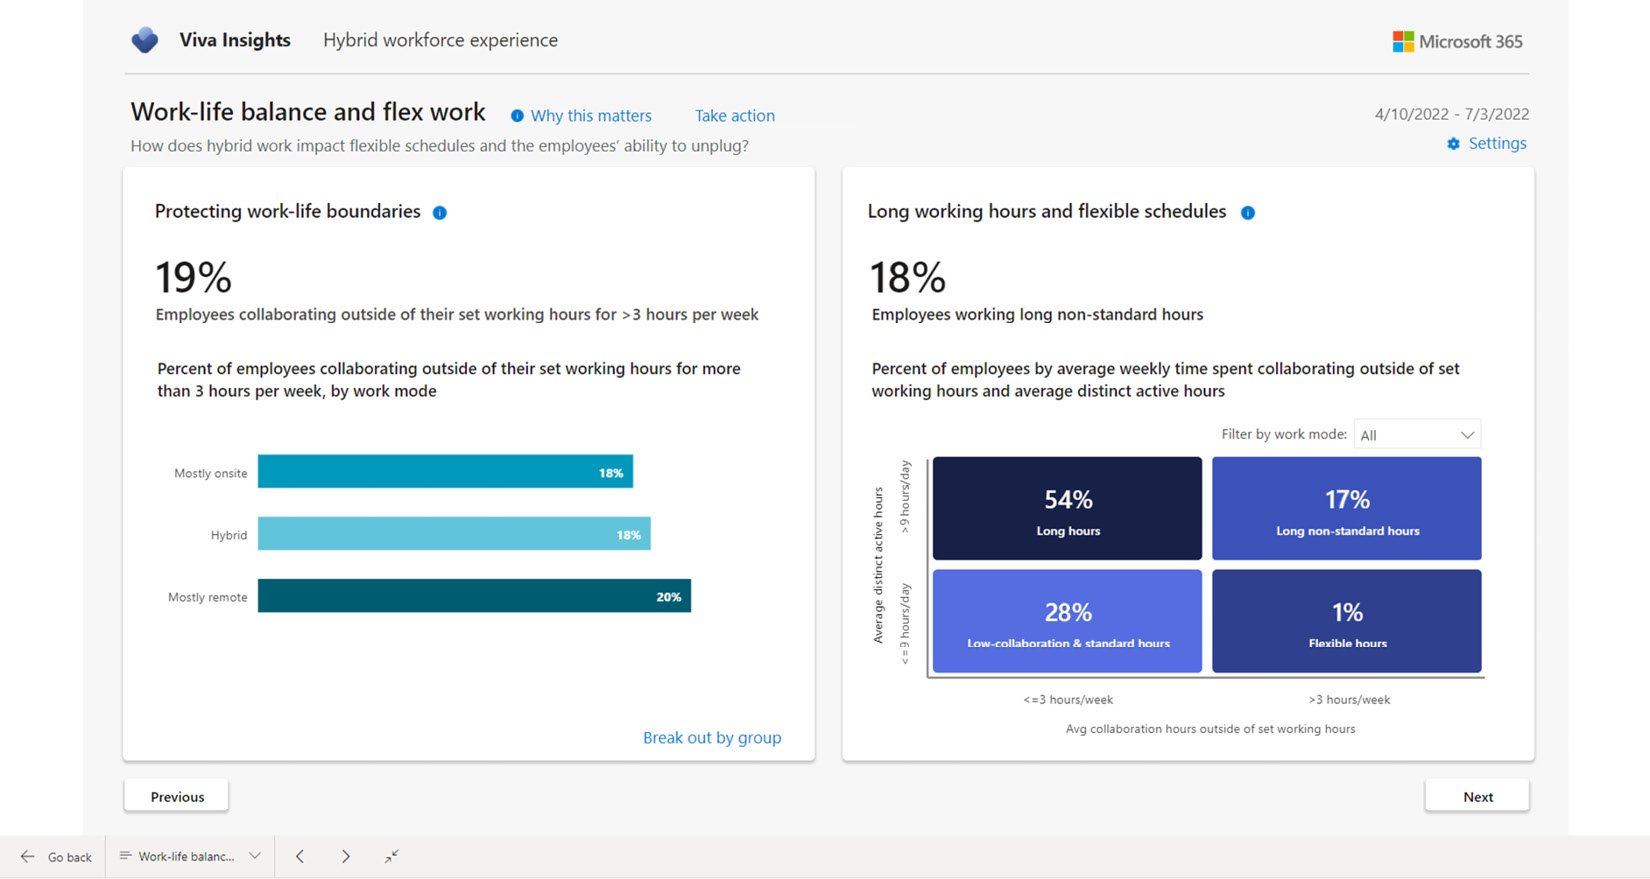
Figure 1.30 – Advanced insights working hour details
The advanced insights Power BI report templates provide an analysis of employee engagement and work patterns. The reports include the following:
- Business resilience: Overall business report highlighting performance and employee well-being.
- Hybrid workforce experience: This report highlights how different work modes (onsite, hybrid, and remote) affect workers.
- Manager effectiveness: Provides insight into patterns exhibited by people managers.
- Meeting effectiveness: These reports capture and display information on meeting statistics such as how many meetings happen on short notice or how much multitasking occurs during meetings.
- Ways of working: This data helps answer questions such as are employees receiving enough 1:1 coaching time? and who generates the most work by organizing meetings?
- Wellbeing – balance and flexibility: Reporting data used to identify whether employees have enough time to focus on core priorities and can balance that with breaks and time away from work.
- For more information on the advanced insights templates and their reporting capabilities, see https://learn.microsoft.com/en-us/viva/insights/advanced/analyst/templates/introduction-to-templates.
Adoption Score
Formerly known as Productivity Score, Adoption Score is a metric that is used to help measure the success of an organization’s use of the Microsoft 365 platform. Before Adoption Score can be used, it must be enabled in the Microsoft 365 admin center under Reports, as shown in Figure 1.31:
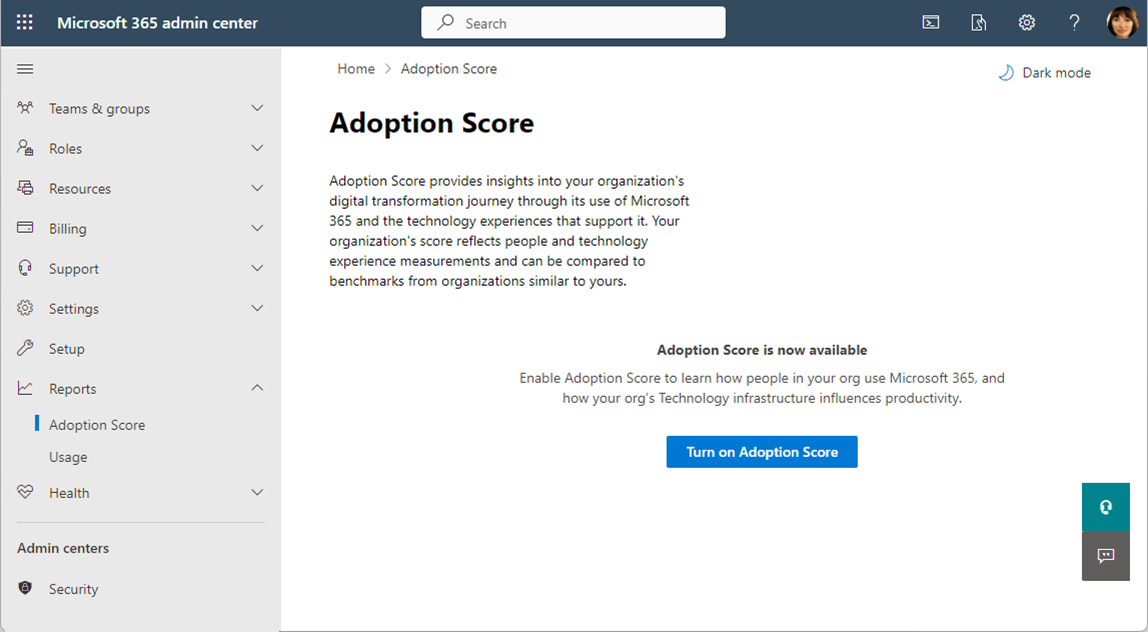
Figure 1.31 – Enabling Adoption Score
Adoption Score provides insights that are broken up into three categories: people experiences, technology experiences, and special reports. When enabling the score, you can select how to calculate insights into people experiences:
- Include all users
- Exclude specific users by group
- Don’t calculate for any users
Insights into technology experiences are shown automatically when you enable Adoption Score. If you don’t want to collect that data, you can disable Endpoint analytics scope in the Intune data collection policy,
If you are performing a staged rollout of services using a pilot program, it may be beneficial to limit the reporting scope to groups of users that are part of the pilot.
People Experiences
The insights into people experiences focus on five categories that show how your users and organization are using the tools in the Microsoft 365 platform. These insight areas are as follows:
- Communication: This area measures how people are communicating with each other, such as sending emails or instant messages or posting on communities in Viva Engage (or Yammer). This area highlights important practices such as using
@mentionsin emails and marking responses as answers in Yammer. Users need to be licensed for Yammer, Exchange Online, or Teams to be counted in this metric. - Content collaboration: This area measures how people use files in your organization, such as creating or sharing files in OneDrive for Business and SharePoint Online or how email attachments are being used (attached files versus a cloud attachment—a link to a file shared in OneDrive or SharePoint). It also captures data about the number of files shared and whether the collaborators are internal or external to the organization. Users need to be licensed for OneDrive for Business, SharePoint, or Exchange Online to be counted in this metric.
- Mobility: This measures what devices and interfaces people are using to accomplish their work. For example, a user sending an email from the Outlook desktop app and the Outlook mobile app would be regarded as an individual using the Microsoft 365 apps across multiple platforms. This measurement area also reports on what locations people are working from—whether they are onsite in one of your organization’s offices or remotely. In order to be counted in this metric, users need to be licensed for Teams, Exchange Online, or Microsoft 365 apps.
- Meetings: This area measures how effectively meetings are used across your organization. Meetings are evaluated against practices such as scheduling meetings at least 24 hours in advance, sharing agendas, and the percentage of invitees that actually show up to the meetings. Other features include measuring interactivity (hand-raising, chat, reactions, or sharing content) during the meeting as well as whether or not attendees are participating via audio or video. Users must be licensed for Microsoft Teams to be included in this metric.
- Teamwork: This area is used to measure how people are collaborating in Teams and using shared workspaces (such as teams, channels, Microsoft 365 groups, and SharePoint sites). In order to be counted for this metric, users must be licensed for Exchange Online, SharePoint, or Microsoft Teams.
In addition to users requiring licenses to be assigned, they also need to be active in a service at least once every 28 days to get counted for that service. You can use Adoption Score to review how people are using the Microsoft 365 service and provide coaching on best practices to get the most out of the platform.
Technology Experiences
The technology experiences category focuses on areas relating to the devices that people are using to access Microsoft 365 services:
- Endpoint analytics: This area provides insights into the overall performance data of devices that are enrolled in Intune or Configuration Manager with tenant attach. The performance metrics include things such as boot time, how long it takes to sign in and get to a responsive desktop, how much time is spent processing Group Policy, how often applications hang or crash, and the number of active devices that have launched a particular app during the past 14 days. The endpoint analytics reporting has special requirements, such as particular versions of endpoints and being either Azure AD joined or hybrid Azure AD joined, as well as licensed for Intune or Microsoft Endpoint Configuration Manager.
- Network connectivity: These metrics provide insights into factors involving network communication between your endpoints and the Microsoft 365 platform. Specific network requirements must be met, such as configuring networks in the Microsoft 365 admin center and enabling location data collection features. For more information on the prerequisites for enabling network connectivity reporting, see https://learn.microsoft.com/en-us/microsoft-365/enterprise/office-365-network-mac-perf-overview?view=o365-worldwide.
- Microsoft 365 Apps: View insights on how many devices across your organization are up to date with their Microsoft 365 app deployments.
The technology experiences score reports can be helpful in gaining insight into how devices may be affecting the overall adoption and user satisfaction with Microsoft 365 services.
Special Reports
Finally, there is a lightweight version of the Business Resilience report (from Viva Insights) that is available to organizations that have at least 100 active Exchange and Viva Insights licenses. This report helps organizational leaders understand how to utilize remote work and maintain a work-life balance, the effectiveness of virtual meetings, and participation in Yammer communities.