

This recipe introduces another perspective. This perspective is more helpful for administrative purposes.
The Administration Console perspective helps with the administration aspects of SAP HANA. This perspective is helpful for SAP HANA technology users (database administrators) who work on regular administrative tasks which involve maintaining and monitoring system status, monitoring disk volume usage, configuring alerts, and so on.
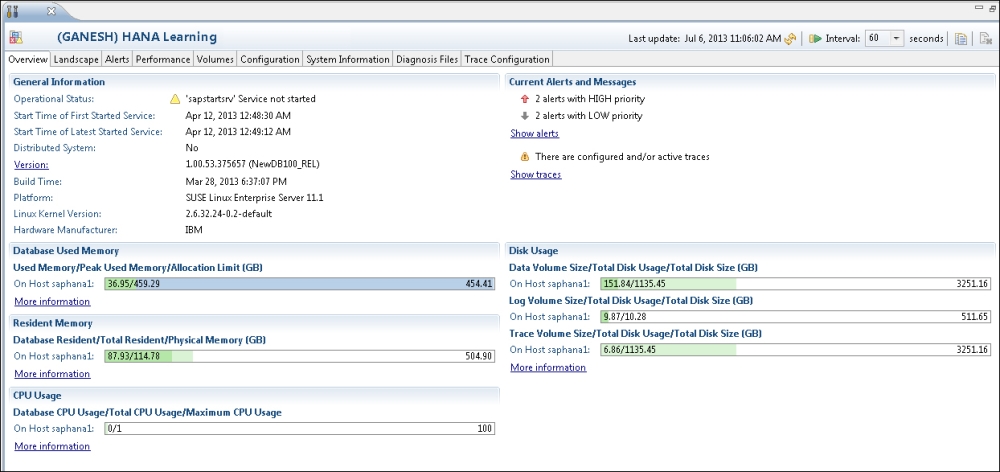
Let us go through the different options in this perspective. The following screenshot illustrates the Administration Console perspective:
We need to configure a system in SAP HANA Studio before starting to work on it. There could be different systems available in the landscape—Development, Quality, and Production. The following is the process of adding a system.
In order to connect to a SAP HANA instance, we need to know the server credentials and details (user ID, server, password, and instance number). The left-hand side of the studio Navigator Pane shows the available HANA instances in SAP HANA Studio. Following are the steps to add a new system:
Right-click in the Navigator space and click on Add System, as shown in the following screenshot:

Enter the values for SAP HANA Hostname and Instance Number and then click on Next, as shown in the following screenshot:

Enter the database credentials—User Name and Password—to connect to the SAP HANA database. After the successful connection to SAP HANA, click on Next and then click on Finish, as shown in the following screenshot:

The SAP HANA system now appears in the Navigator Pane, as shown in the following screenshot:

Apart from adding a system, there are other activities as well that can be done in the Administration Console perspective.
In this tab, we can have a snapshot of the overall status of the system. As shown in the screenshot in the Getting ready section of this recipe, it includes the system status, build version, hardware and software details, disk memory utilization, CPU utilization, and so on. We can dive into each category to get in-depth details.
In the Landscape menu, we can have a glance at different services running and their administration, configuring hosts, redistribution operation on tables, and so on.
Under this category, activities related to services are handled. All the services running across every host will be available here. We can start, stop, or kill the services. Memory usage and allocation details across different servers can be monitored, and the result set can be customized by fields to be displayed.
Hosts can be configured using Configuration. Assignment details of master/slaves for all servers can be monitored from this screen.
Tables have to be redistributed among index servers for effective utilization of resources and optimal performance. Performance will be optimal when frequently joined tables are located in the same index server compared to those that are spread into different index servers. Therefore, it is highly recommended to distribute the tables among index servers. This can be performed soon after adding the hosts or later as well based on the models we build on the tables, for which we have separate options available.
The same operation has to be applied for partitioned tables as well. Partitioned tables will be distributed across different index servers. This location can be specified manually or determined by the database when it has been partitioned initially. The size of these partitions will be growing in time, which may not give us optimal results. Therefore, it is required to redistribute the partition tables as well.
For an administrator, system status, services, and resources have to be monitored continuously. Configuring alerts will help in making timely decisions. In the generation of alerts, the statistics server plays a major role. When the SAP HANA system is started, the statistics server is automatically activated on the host of the active master name server. The statistics server runs SQL commands internally and collects all the information from all index servers. From this data, important alerts information will be displayed in the Overview tab and the Alerts tab will hold detailed level data.
E-mail notifications can be configured for these alerts and thereby all stakeholders will be updated on alerts. The sender's e-mail address, recipient's e-mail address, and SMTP port details are required for this setting. The recipients listed will be notified by e-mail upon generation of alerts by the statistics server.
All performance-related processes can be monitored from this tab. This includes threads, sessions, SQL cache, expensive statements, progress in jobs, load details, and so on.
Whenever there is an I/O operation in the SAP HANA system, it starts threads on the corresponding server. The detailed level of data on these threads can be monitored and can be cancelled if required. Similarly, details related to open sessions, SQL plan cache, expensive statements executed, and jobs which are progressing can be monitored.
Apart from these, the load impact on the SAP HANA system can be monitored. Flexible options are provided to change the filters dynamically so that we can drill down or drill up on the data of any server in the host. This really helps in understanding where the server is being impacted with peak loads on which server.
It makes no sense if system resources are not effectively utilized after taking on a powerful, in-memory database such as SAP HANA.
The Volumes tab gives us complete detail on the memory statistics of all servers (name server, index server, statistics server, and XS Engine) on the host. This includes total disk size, used disk size, remaining disk size, and volume size. Details about data volumes, log volumes along with the page size, and block size are also available.
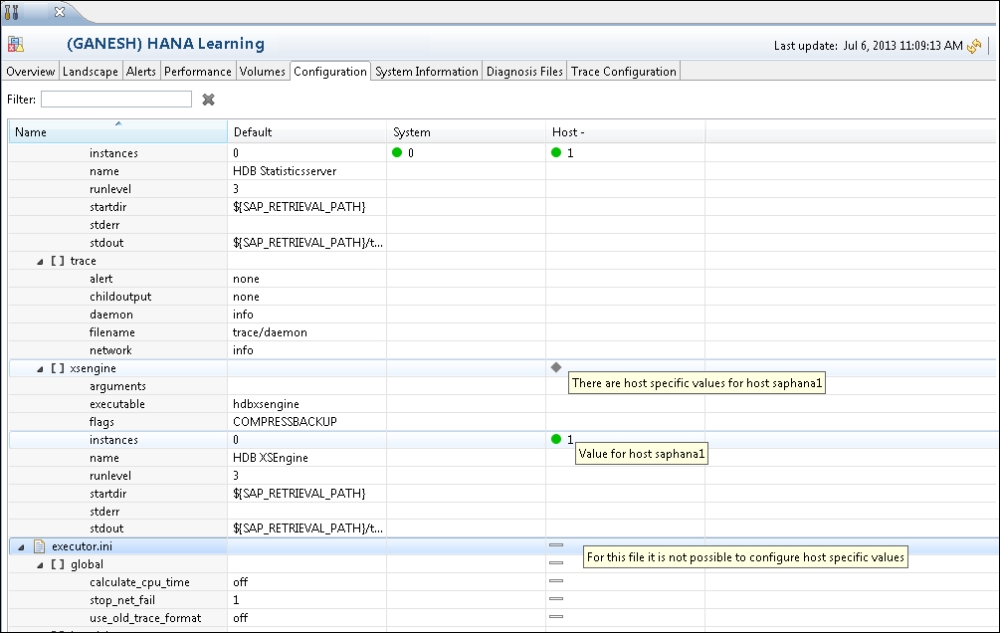
The Configuration tab has highly sensitive data as all the system configurations are maintained in this section. For the SAP HANA system, configurations are stored in the form of configuration files—the .ini files. We will have several values, and these settings can be changed for the host or the entire system. When the value is changed, a green mark will be shown indicating changed values. Against a few values, a minus sign will be displayed. We cannot change these values and they are set by the system itself, as shown in the following screenshot:
The System Information tab holds the system information table, which has data related to the SAP HANA system. Data in each table can be viewed and a detailed analysis can be performed to take decisions for system maintenance. This includes tables on memory consumption, work load statistics, transactions in use, and many more.
Trace and logfiles of the system can be browsed from this menu (all the trace and logfiles right from the starting date of the system setup). These files can be viewed or downloaded to a local PC.
Detailed information about the actions of the HANA database can be obtained using different traces. We can activate these traces and configure them as per our requirements.
We can configure the following traces:
|
S No |
Trace |
Default Configuration |
|---|---|---|
|
1 |
SQL trace |
Inactive |
|
2 |
Performance trace |
Inactive |
|
3 |
Kernel profiler trace |
Inactive |
|
4 |
Global database trace |
Active with default trace level ERROR |
|
5 |
Database trace |
Active with default trace level ERROR |
|
6 |
User-specific trace |
Not specified |
|
7 |
End-to-end trace |
Active with default trace level ERROR |
|
8 |
Expensive statements trace |
Inactive |
SAP HANA Administration Guide at http://help.sap.com/hana/SAP_HANA_Administration_Guide_en.pdf