Sign In Start Free Trial
Account

Add to playlist

Create a Playlist

Modal Close icon
You need to login to use this feature.
  • Book Overview & Buying R Graph Essentials
  • Table Of Contents Toc
R Graph Essentials

R Graph Essentials

4.5 (4)
close
close
R Graph Essentials

R Graph Essentials

4.5 (4)

Overview of this book

This book is targeted at R programmers who want to learn the graphing capabilities of R. This book will presume that you have working knowledge of R.
Table of Contents (6 chapters)
close
close
5
Index

Creating and joining points

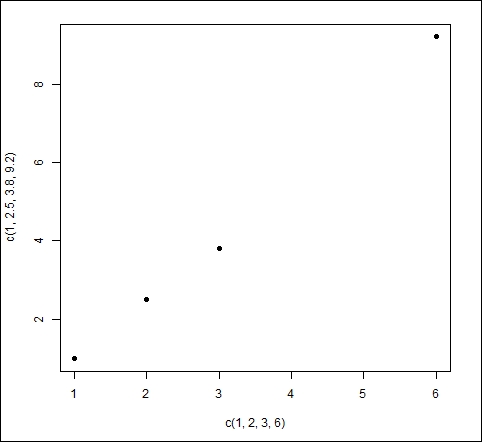
Now, let's look at graphing individual points and creating lines that join them. We start off with a simple plot that has four points. We use the plot() command and group the x coordinates together and the y coordinates together. To do this job, we use the c operator to combine the x values and y values independently. Both groups of coordinates are written within parentheses, inside the plot() command. Enter the following syntax on the command line to create a graph with four points:

plot(c(1, 2, 3, 6), c(1, 2.5, 3.8, 9.2), pch = 16)

This command gives the following plot:

Creating and joining points

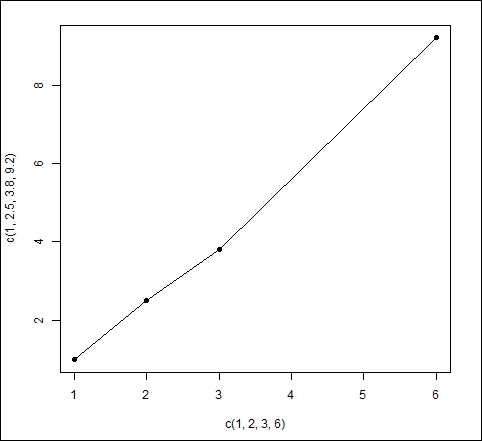
Note how the elements of the first vector gave the horizontal axis values, while the elements of the second vector gave the vertical axis values. Now, we join the four points using the lines() command, again grouping the horizontal axis values together and the vertical axis values together:

lines(c(1, 2, 3, 6), c(1, 2.5, 3.8, 9.2))

The following is the resulting graph, in which the points are now connected by line segments:

Creating and joining points

When you encounter plotting commands and arguments and want to know more about them, on the R command line, enter a question mark followed immediately by the command name (for example, ?plot()) and you will be taken directly to an online help page. You can also try several online resources. One of the best is the Quick-R website (http://statmethods.net/), which I mentioned earlier. Go straight to the Basic Graphs and Advanced Graphs pages. These pages give you a very helpful summary of the main plotting parameters (symbol types, line types, and parameters that control axes, titles, labels, and legends).

Alternatively, you can use a sensible web search (for example, enter R graphs in Google) and you will find several options.

CONTINUE READING
83
Tech Concepts
36
Programming languages
73
Tech Tools
Icon Unlimited access to the largest independent learning library in tech of over 8,000 expert-authored tech books and videos.
Icon Innovative learning tools, including AI book assistants, code context explainers, and text-to-speech.
Icon 50+ new titles added per month and exclusive early access to books as they are being written.
R Graph Essentials
notes
bookmark Notes and Bookmarks search Search in title playlist Add to playlist font-size Font size

Change the font size

margin-width Margin width

Change margin width

day-mode Day/Sepia/Night Modes

Change background colour

Close icon Search
Country selected

Close icon Your notes and bookmarks

Confirmation

Modal Close icon
claim successful

Buy this book with your credits?

Modal Close icon
Are you sure you want to buy this book with one of your credits?
Close
YES, BUY

Submit Your Feedback

Modal Close icon
Modal Close icon
Modal Close icon