Sign In Start Free Trial
Account

Add to playlist

Create a Playlist

Modal Close icon
You need to login to use this feature.
  • Book Overview & Buying Learning Predictive Analytics with Python
  • Table Of Contents Toc
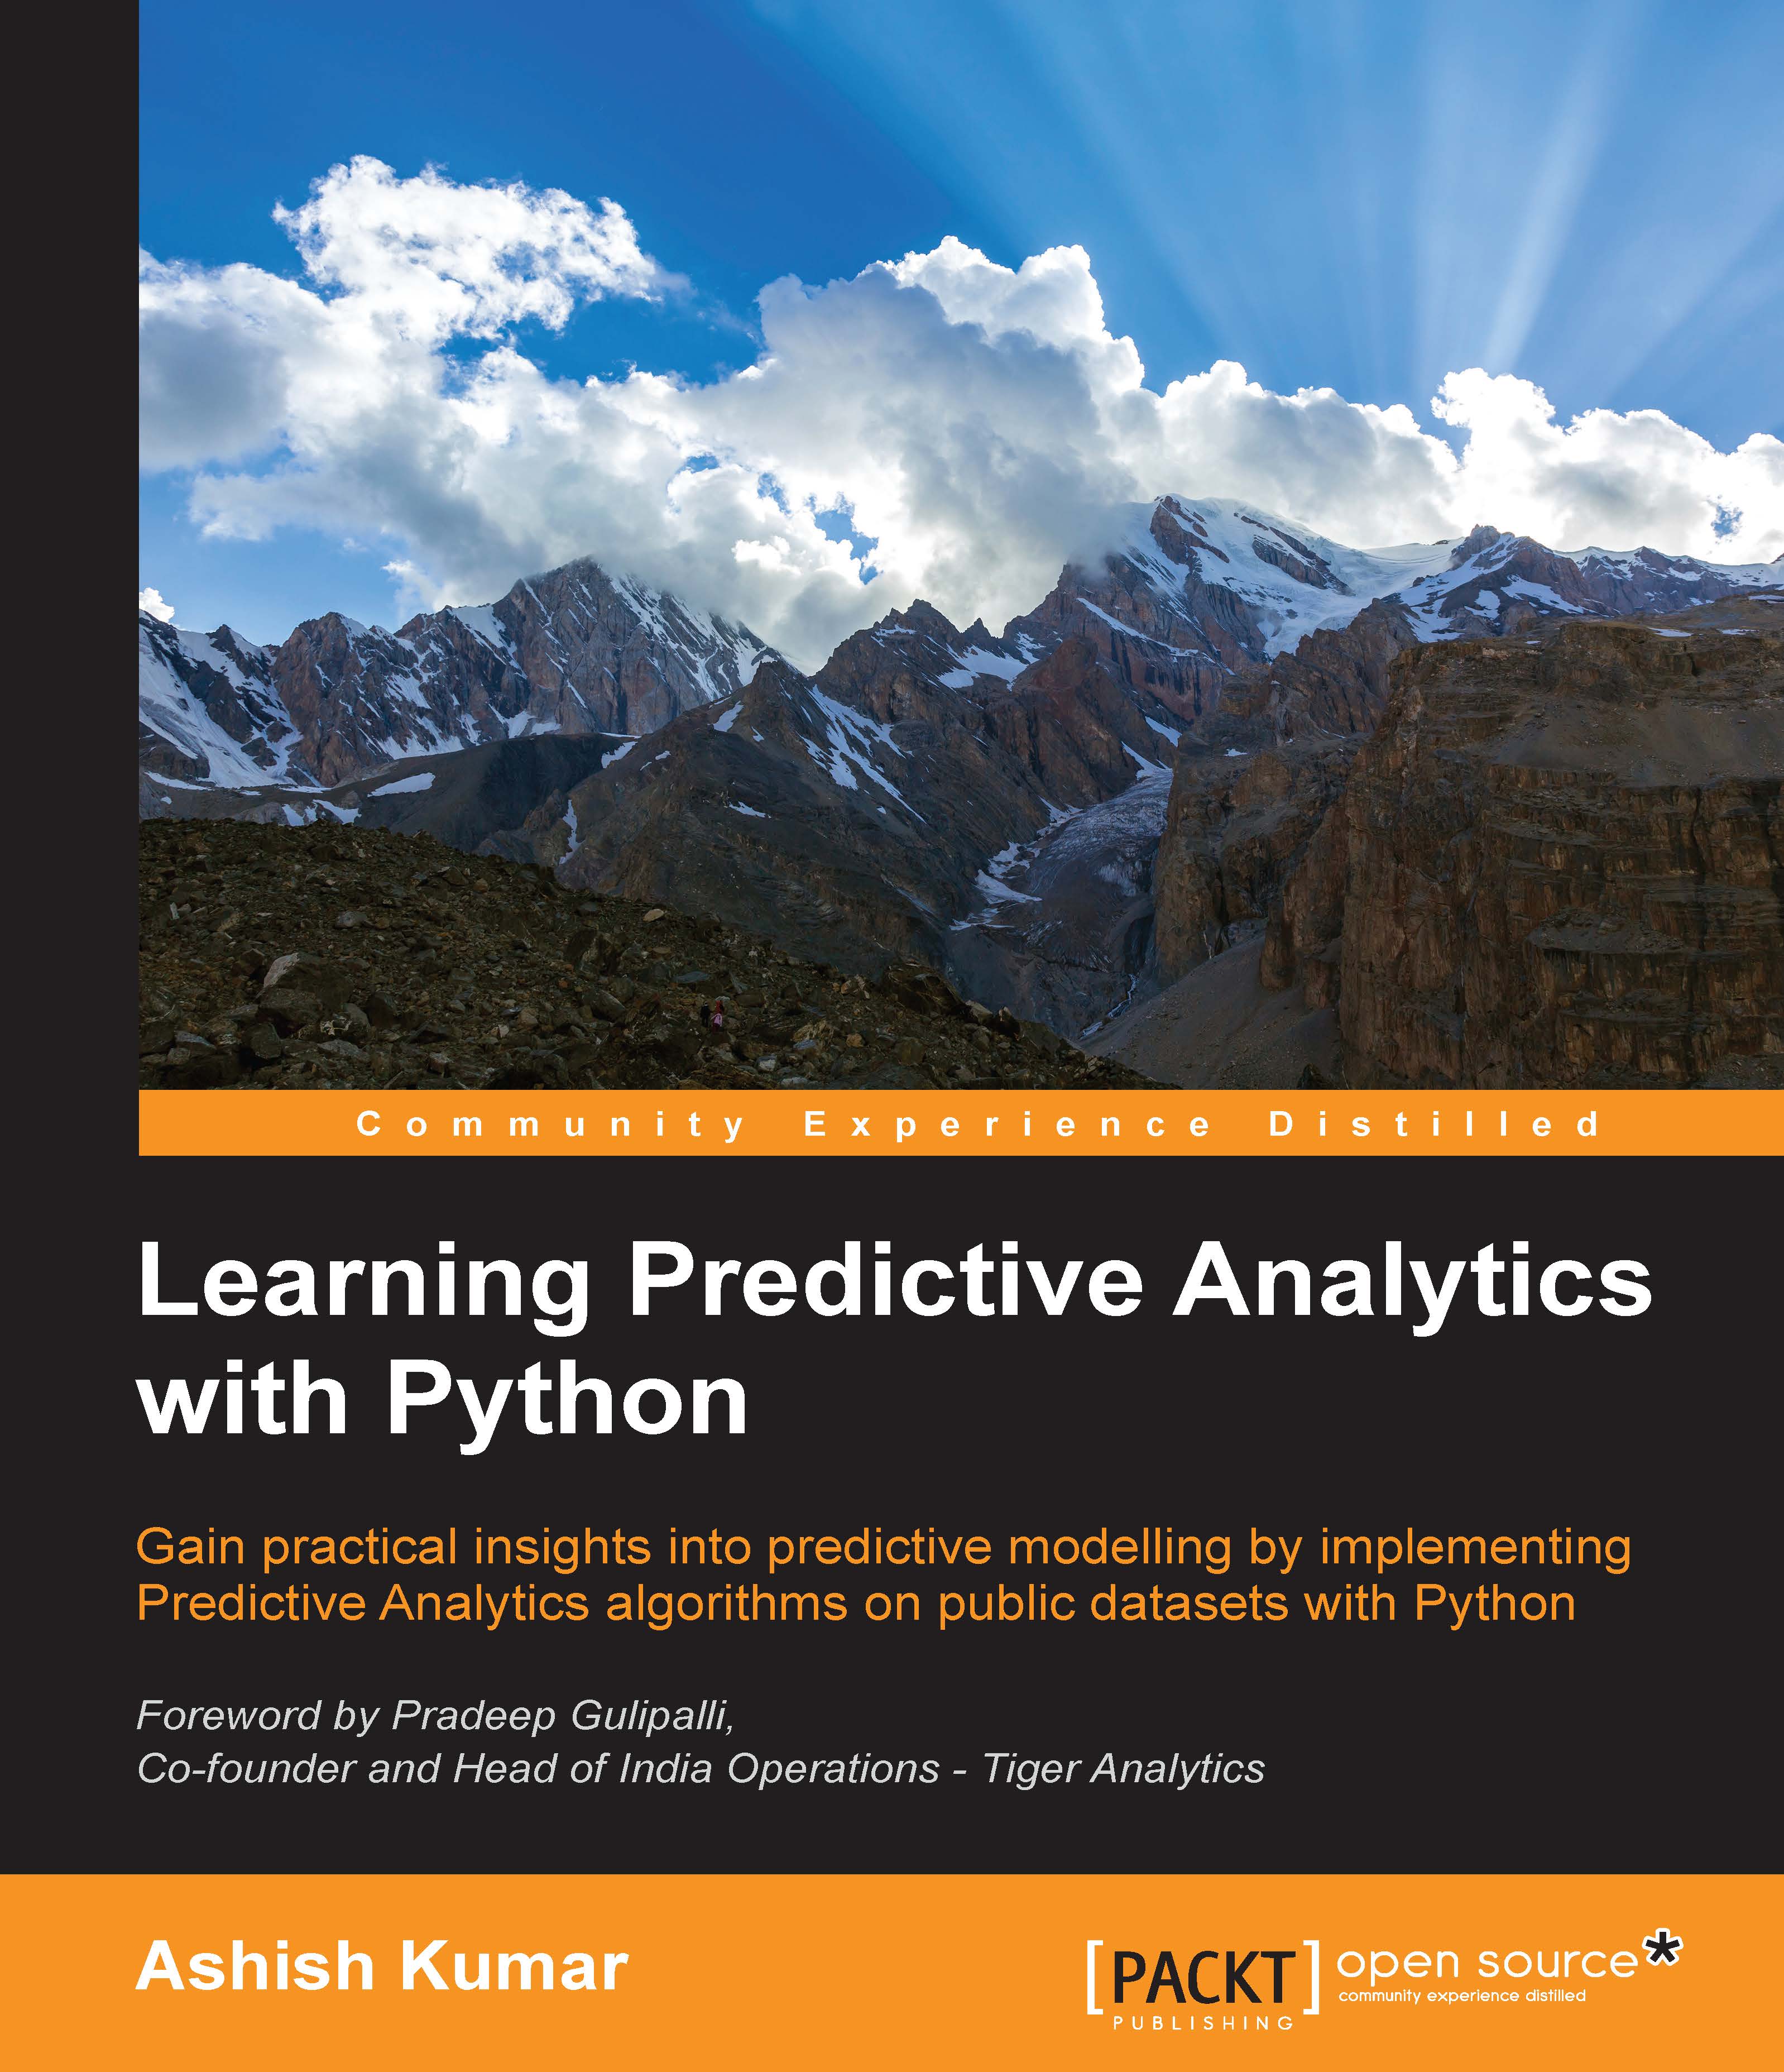
Learning Predictive Analytics with Python

Learning Predictive Analytics with Python

By : Kumar, Gary Dougan
3.4 (11)
close
close
Learning Predictive Analytics with Python

Learning Predictive Analytics with Python

3.4 (11)
By: Kumar, Gary Dougan

Overview of this book

Social Media and the Internet of Things have resulted in an avalanche of data. Data is powerful but not in its raw form - It needs to be processed and modeled, and Python is one of the most robust tools out there to do so. It has an array of packages for predictive modeling and a suite of IDEs to choose from. Learning to predict who would win, lose, buy, lie, or die with Python is an indispensable skill set to have in this data age. This book is your guide to getting started with Predictive Analytics using Python. You will see how to process data and make predictive models from it. We balance both statistical and mathematical concepts, and implement them in Python using libraries such as pandas, scikit-learn, and numpy. You’ll start by getting an understanding of the basics of predictive modeling, then you will see how to cleanse your data of impurities and get it ready it for predictive modeling. You will also learn more about the best predictive modeling algorithms such as Linear Regression, Decision Trees, and Logistic Regression. Finally, you will see the best practices in predictive modeling, as well as the different applications of predictive modeling in the modern world.
Table of Contents (12 chapters)
close
close
10
A. A List of Links
11
Index

Handling missing values


Checking for missing values and handling them properly is an important step in the data preparation process, if they are left untreated they can:

  • Lead to the behavior between the variables not being analyzed correctly

  • Lead to incorrect interpretation and inference from the data

To see how; move up a few pages to see how the describe method is explained. Look at the output table; why are the counts for many of the variables different from each other? There are 1310 rows in the dataset, as we saw earlier in the section. Why is it then that the count is 1046 for age, 1309 for pclass, and 121 for body. This is because the dataset doesn't have a value for 264 (1310-1046) entries in the age column, 1 (1310-1309) entry in the pclass column, and 1189 (1310-121) entries in the body column. In other words, these many entries have missing values in their respective columns. If a column has a count value less than the number of rows in the dataset, it is most certainly because the...

CONTINUE READING
83
Tech Concepts
36
Programming languages
73
Tech Tools
Icon Unlimited access to the largest independent learning library in tech of over 8,000 expert-authored tech books and videos.
Icon Innovative learning tools, including AI book assistants, code context explainers, and text-to-speech.
Icon 50+ new titles added per month and exclusive early access to books as they are being written.
Learning Predictive Analytics with Python
notes
bookmark Notes and Bookmarks search Search in title playlist Add to playlist font-size Font size

Change the font size

margin-width Margin width

Change margin width

day-mode Day/Sepia/Night Modes

Change background colour

Close icon Search
Country selected

Close icon Your notes and bookmarks

Confirmation

Modal Close icon
claim successful

Buy this book with your credits?

Modal Close icon
Are you sure you want to buy this book with one of your credits?
Close
YES, BUY

Submit Your Feedback

Modal Close icon
Modal Close icon
Modal Close icon