

Excel has several other features and add-ins that make it a great tool for business intelligence. The following features are worth exploring for your analytics use cases.
Note
For the features that are discussed in the following section, you might need to install additional software on top of Excel.
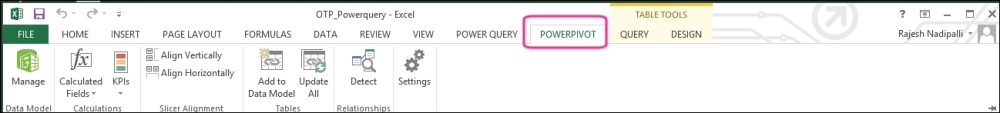
The PowerPivot allows you to build a data model, calculate key performance indicators (KPI), detect relationships, and visualize using charts or tables. The following screenshot shows you the POWERPIVOT menu:
Power View reports allow a host of new visualizations of your KPIs, including a Map view where you can geographically report your results. This feature is under the INSERT | Power View Reports submenu, as shown in the following screenshot:

If your data has geographical information such as state, city, or latitude and longitude, you can visualize this information easily by a few clicks in Excel. Let's consider our sample project with...