

The radar series is rendered using the polar chart as it works with the polar coordinate system. It uses the radial and angular axes to determine the position of a point. The following diagram depicts Radar where we have marked different areas, such as the axis, legend, series, and sprite:
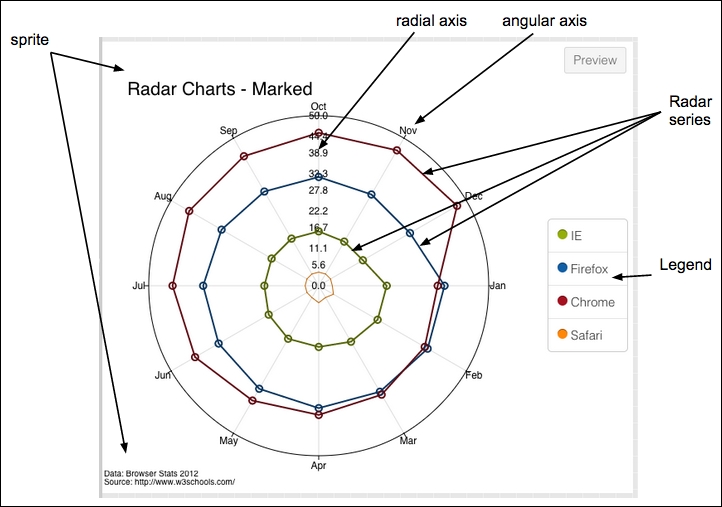
In the preceding diagram, the Radar series is used with two axes:
The
numericaxis along the radius to show the browser usage dataThe
categoryaxis along the angular direction to show the month
The following diagram shows the different classes involved in the construction and initialization of a chart with the Radar series and the control flow:
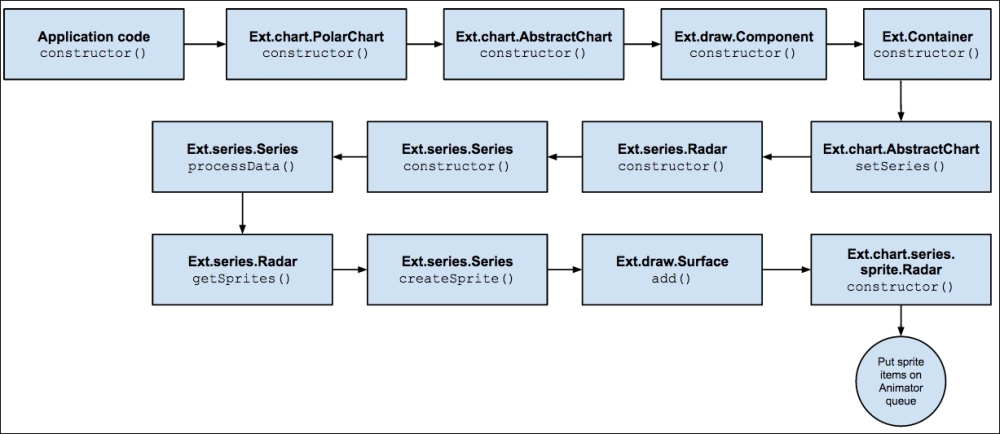
This is similar to the CandleStick series that we saw earlier, except that in place of CartesianChart, PolarChart is used and in place of the CandleStick series (and related sprites), the Radar series' (and related sprites) classes are used.
When it comes to rendering a polar chart, again, the steps are consistent with that of a...