-
Book Overview & Buying
-
Table Of Contents

Practical Business Intelligence
Practical Business Intelligence
Overview of this book
Business Intelligence (BI) is at the crux of revolutionizing enterprise. Everyone wants to minimize losses and maximize profits. Thanks to Big Data and improved methodologies to analyze data, Data Analysts and Data Scientists are increasingly using data to make informed decisions. Just knowing how to analyze data is not enough, you need to start thinking how to use data as a business asset and then perform the right analysis to build an insightful BI solution. Efficient BI strives to achieve the automation of data for ease of reporting and analysis.
Through this book, you will develop the ability to think along the right lines and use more than one tool to perform analysis depending on the needs of your business. We start off by preparing you for data analytics. We then move on to teach you a range of techniques to fetch important information from various databases, which can be used to optimize your business.
The book aims to provide a full end-to-end solution for an environment setup that can help you make informed business decisions and deliver efficient and automated BI solutions to any company.
It is a complete guide for implementing Business intelligence with the help of the most powerful tools like D3.js, R, Tableau, Qlikview and Python that are available on the market.
Table of Contents (16 chapters)
Practical Business Intelligence

Credits
About the Author
About the Reviewer
www.PacktPub.com
Customer Feedback
Preface
 Free Chapter
Introduction to Practical Business Intelligence
Web Scraping
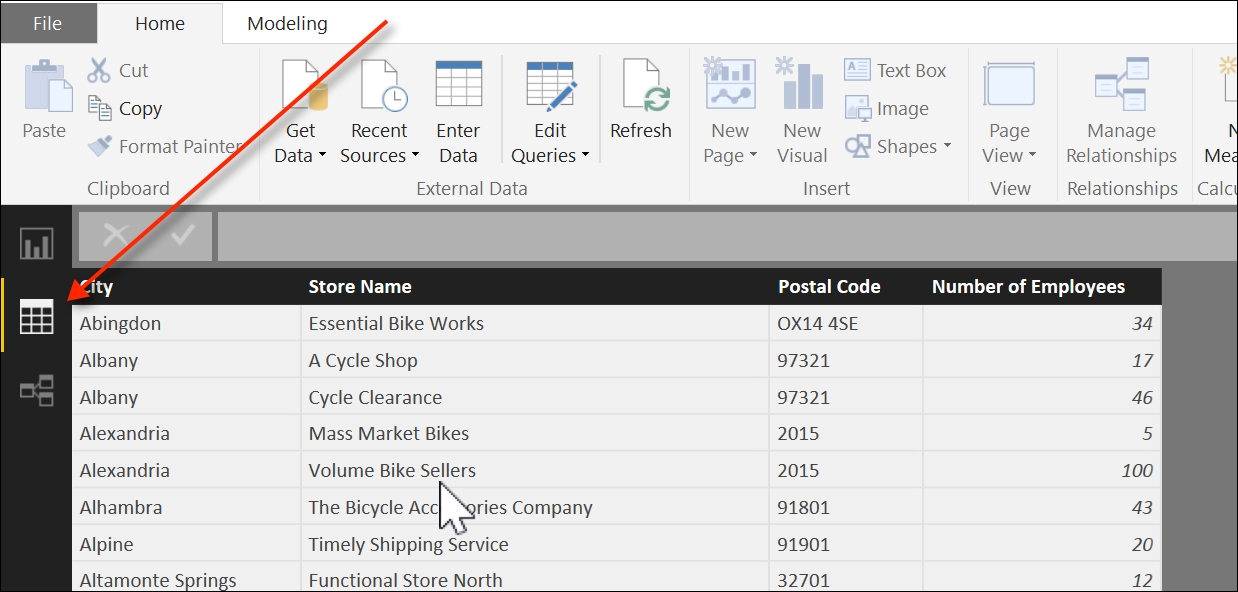
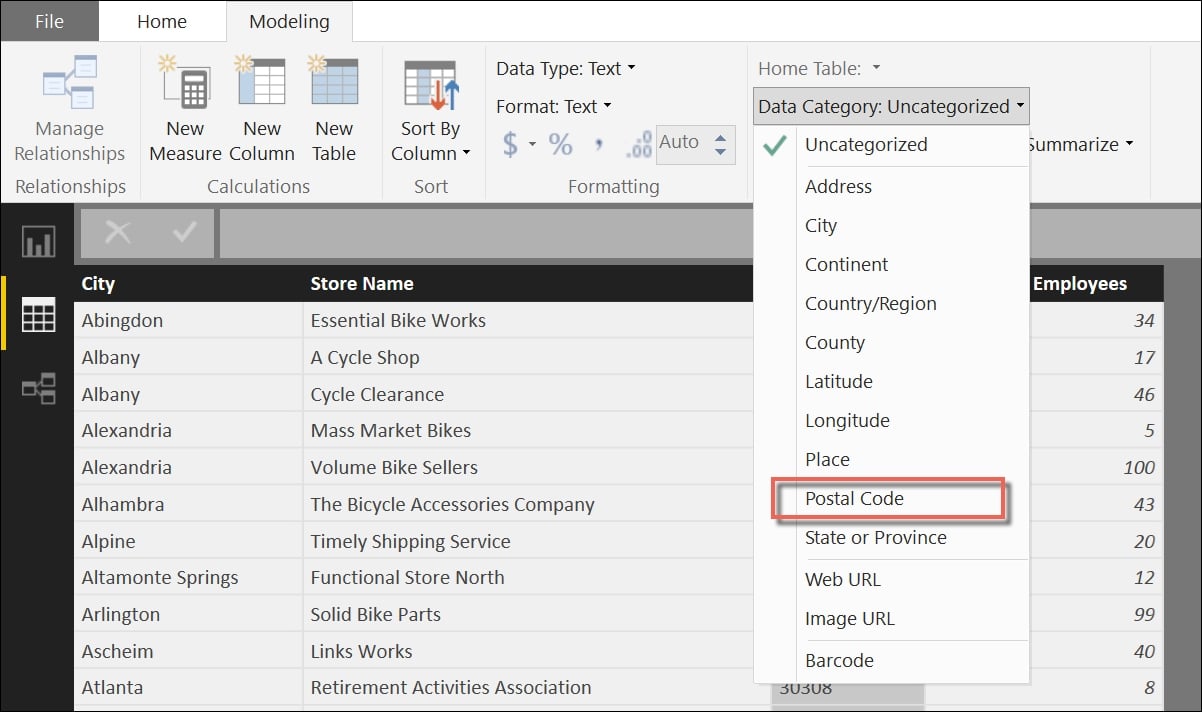
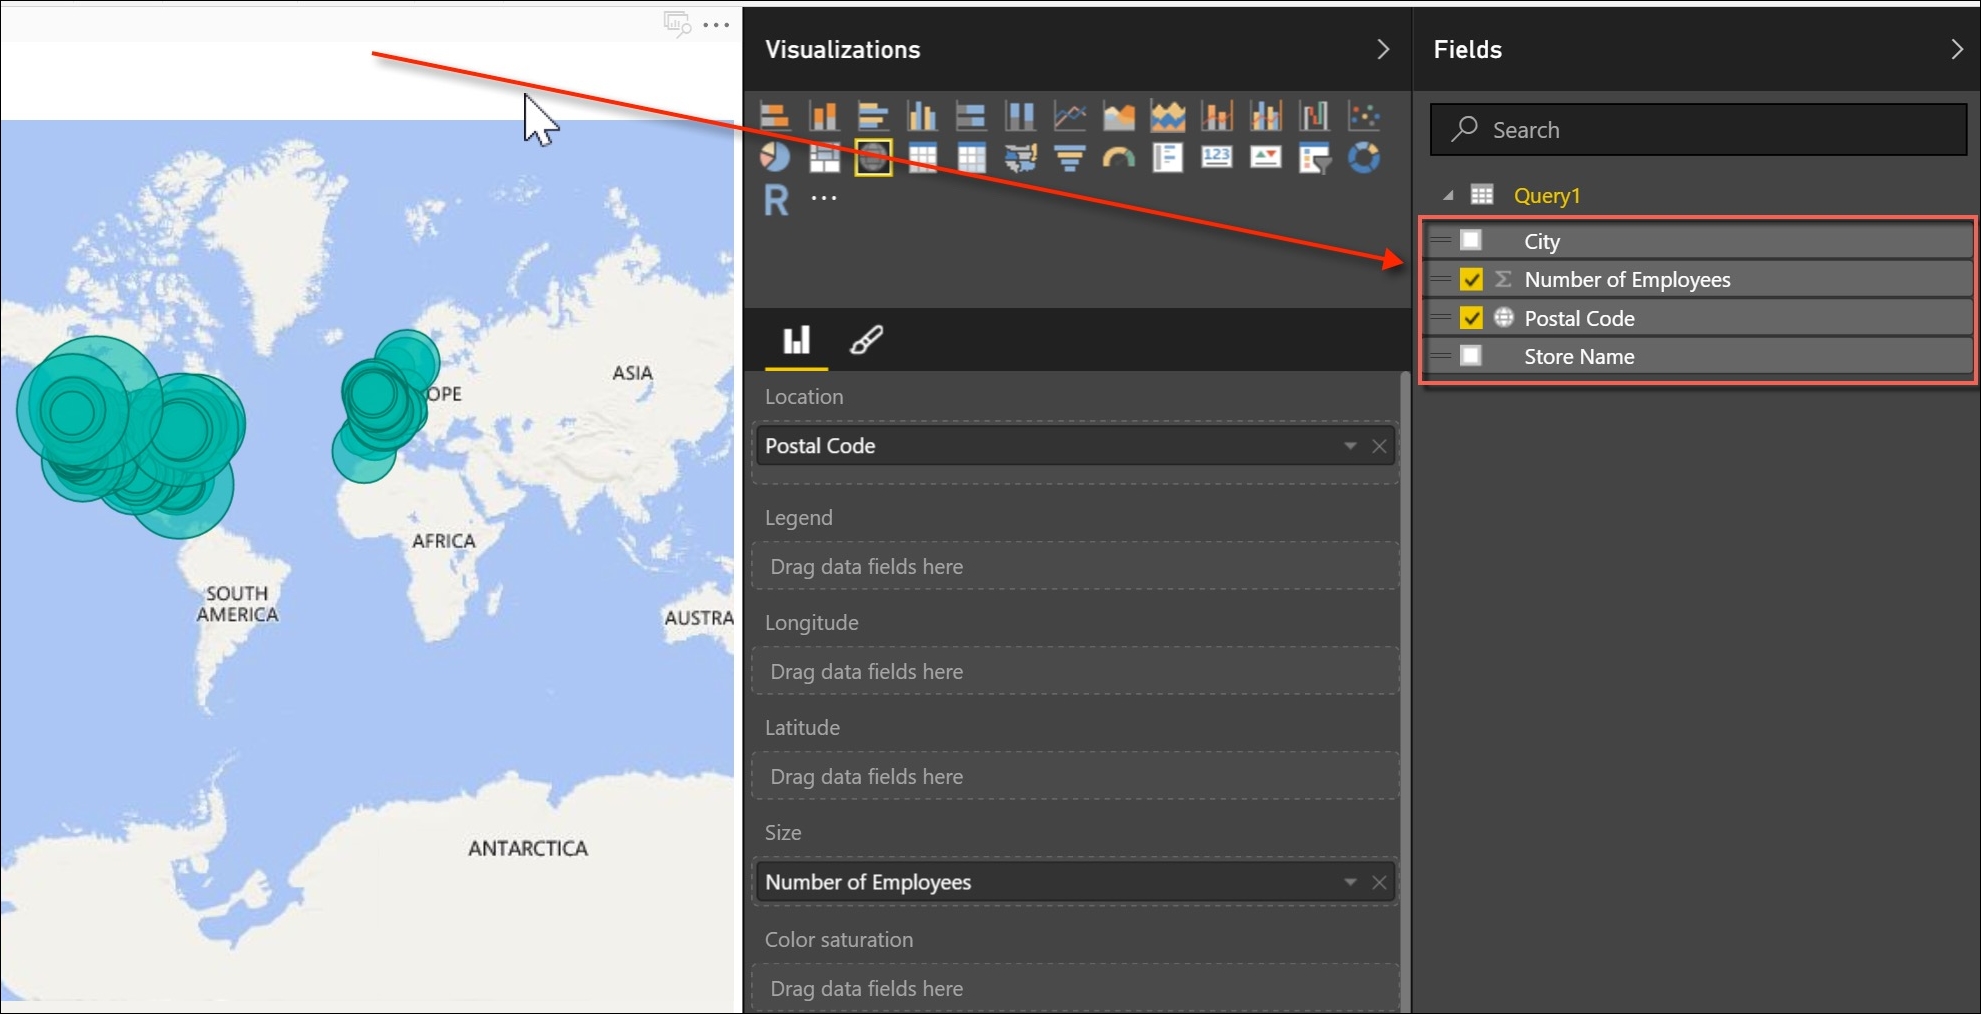
Analysis with Excel and Creating Interactive Maps and Charts with Power BI
Creating Bar Charts with D3.js
Forecasting with R
Creating Histograms and Normal Distribution Plots with Python
Creating a Sales Dashboard with Tableau
Creating an Inventory Dashboard with QlikSense