Book Image

Hands-On SAS for Data Analysis

By : Harish Gulati
Book Image

Hands-On SAS for Data Analysis

By: Harish Gulati

Overview of this book

SAS is one of the leading enterprise tools in the world today when it comes to data management and analysis. It enables the fast and easy processing of data and helps you gain valuable business insights for effective decision-making. This book will serve as a comprehensive guide that will prepare you for the SAS certification exam. After a quick overview of the SAS architecture and components, the book will take you through the different approaches to importing and reading data from different sources using SAS. You will then cover SAS Base and 4GL, understanding data management and analysis, along with exploring SAS functions for data manipulation and transformation. Next, you'll discover SQL procedures and get up to speed on creating and validating queries. In the concluding chapters, you'll learn all about data visualization, right from creating bar charts and sample geographic maps through to assigning patterns and formats. In addition to this, the book will focus on macro programming and its advanced aspects. By the end of this book, you will be well versed in SAS programming and have the skills you need to easily handle and manage your data-related problems in SAS.
Table of Contents (17 chapters)
Free Chapter
1
Section 1: SAS Basics
4
Section 2: Merging, Optimizing, and Descriptive Statistics
7
Section 3: Advanced Programming
10
Section 4: SQL in SAS
13
Section 5: Data Visualization and Reporting

Box plot

The box and whiskers plot, or box plot, it's as popularly called in SAS, is a plot of measurement organized in groups. The box plot displays the mean, quartiles, and minimum and maximum observations for a group. The benefit of a box plot is that it can display a variable's location and spread. It can showcase outliers and provide insight into the skewness of the data:

Title 'Basic Form of Box Plot';
Proc SGPLOT Data=Class;
VBox Height / Category=Year;
Run;

This produces the following chart:

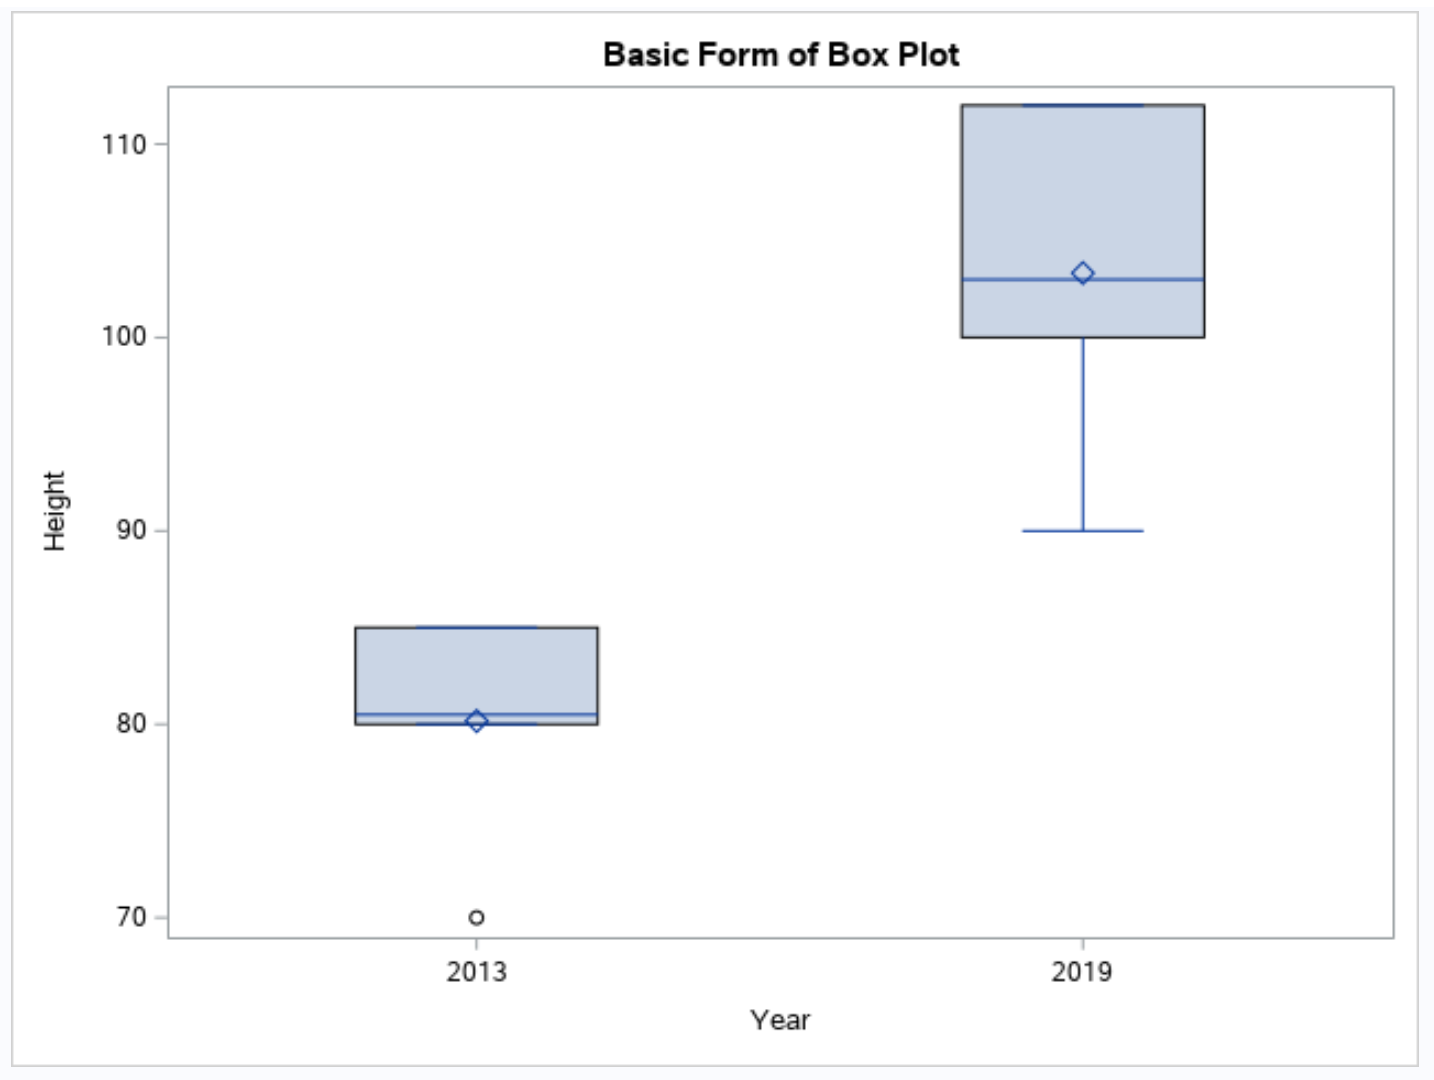
As you can see from the Box Plot, the year 2019 has more variance in the height of students than in 2013.

We can also use the built-in Box Plot procedure as an alternative to the preceding use of the SGPLOT procedure:

Proc Boxplot Data=Class;
Plot Height*Age;
Inset Min Mean Max Stddev / Header='Height Statistics' POS=RM;
Run;

This produces the following...