
Sign In Start Free Trial
Account

Add to playlist

Create a Playlist

Modal Close icon
You need to login to use this feature.
  • Book Overview & Buying Hands-On Data Visualization with Bokeh
  • Table Of Contents Toc
Hands-On Data Visualization with Bokeh

Hands-On Data Visualization with Bokeh

By : Kevin Jolly
3.7 (6)
close
close
Hands-On Data Visualization with Bokeh

Hands-On Data Visualization with Bokeh

3.7 (6)
By: Kevin Jolly

Overview of this book

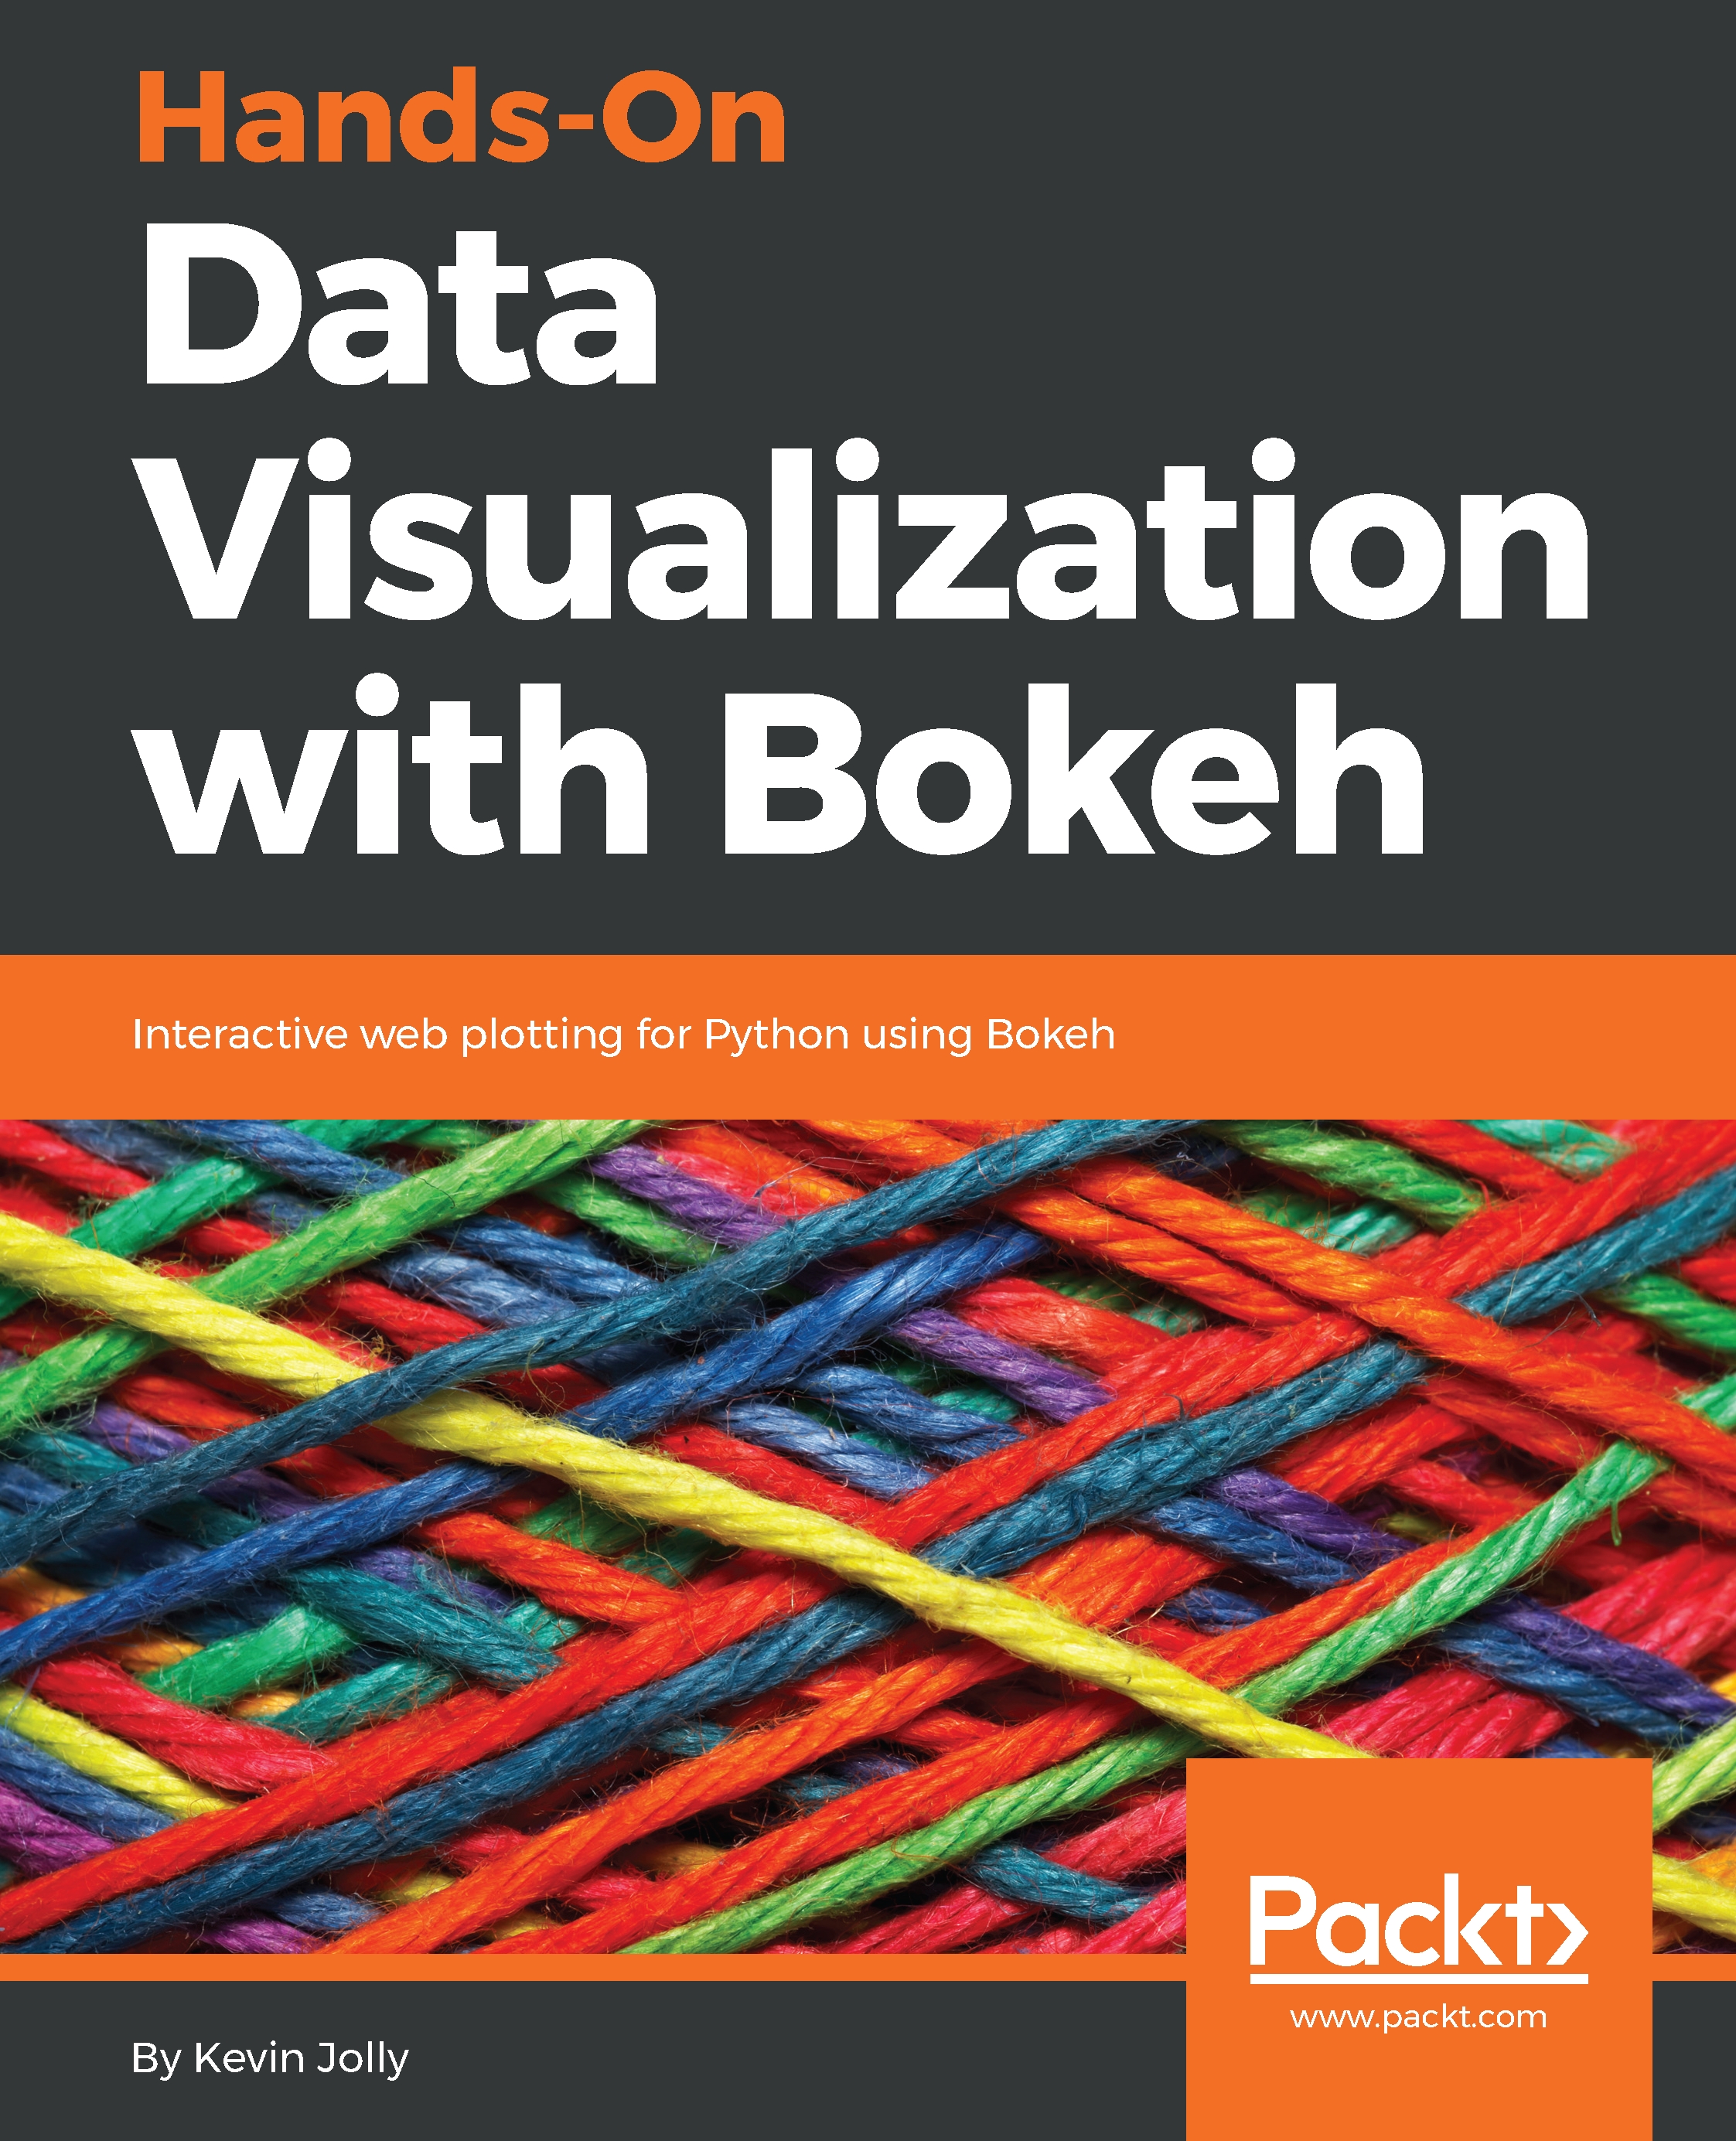
Adding a layer of interactivity to your plots and converting these plots into applications hold immense value in the field of data science. The standard approach to adding interactivity would be to use paid software such as Tableau, but the Bokeh package in Python offers users a way to create both interactive and visually aesthetic plots for free. This book gets you up to speed with Bokeh - a popular Python library for interactive data visualization. The book starts out by helping you understand how Bokeh works internally and how you can set up and install the package in your local machine. You then use a real world data set which uses stock data from Kaggle to create interactive and visually stunning plots. You will also learn how to leverage Bokeh using some advanced concepts such as plotting with spatial and geo data. Finally you will use all the concepts that you have learned in the previous chapters to create your very own Bokeh application from scratch. By the end of the book you will be able to create your very own Bokeh application. You will have gone through a step by step process that starts with understanding what Bokeh actually is and ends with building your very own Bokeh application filled with interactive and visually aesthetic plots.
Table of Contents (10 chapters)
close
close

Summary

In this chapter, you learned how to build a real-time Bokeh visualization that can be used to analyze the performance of stocks from scratch. You learned how to perform initial exploratory data analysis in order to determine the kind of visualization that you wanted to create. You then created the visualization and improved its performance using WebGL.

Finally, you learned the four steps that form an integral part of the Bokeh workflow. You learned how asking the right kinds of questions is pivotal in any data visualization project, followed by the exploratory data analysis. You also learned how presenting your results is not limited to the type of plot you use, but also the tone of the message that you want to convey to the audience.

This concludes the book! I hope the book has given you an informative, hands-on introduction to the world of Bokeh! I hope you will continue...

CONTINUE READING
83
Tech Concepts
36
Programming languages
73
Tech Tools
Icon Unlimited access to the largest independent learning library in tech of over 8,000 expert-authored tech books and videos.
Icon Innovative learning tools, including AI book assistants, code context explainers, and text-to-speech.
Icon 50+ new titles added per month and exclusive early access to books as they are being written.
Hands-On Data Visualization with Bokeh
notes
bookmark Notes and Bookmarks search Search in title playlist Add to playlist download Download options font-size Font size

Change the font size

margin-width Margin width

Change margin width

day-mode Day/Sepia/Night Modes

Change background colour

Close icon Search
Country selected

Close icon Your notes and bookmarks

Confirmation

Modal Close icon
claim successful

Buy this book with your credits?

Modal Close icon
Are you sure you want to buy this book with one of your credits?
Close
YES, BUY

Submit Your Feedback

Modal Close icon
Modal Close icon
Modal Close icon