Book Image

Hands-On Data Visualization with Bokeh

By : Kevin Jolly
Book Image

Hands-On Data Visualization with Bokeh

By: Kevin Jolly

Overview of this book

Adding a layer of interactivity to your plots and converting these plots into applications hold immense value in the field of data science. The standard approach to adding interactivity would be to use paid software such as Tableau, but the Bokeh package in Python offers users a way to create both interactive and visually aesthetic plots for free. This book gets you up to speed with Bokeh - a popular Python library for interactive data visualization. The book starts out by helping you understand how Bokeh works internally and how you can set up and install the package in your local machine. You then use a real world data set which uses stock data from Kaggle to create interactive and visually stunning plots. You will also learn how to leverage Bokeh using some advanced concepts such as plotting with spatial and geo data. Finally you will use all the concepts that you have learned in the previous chapters to create your very own Bokeh application from scratch. By the end of the book you will be able to create your very own Bokeh application. You will have gone through a step by step process that starts with understanding what Bokeh actually is and ends with building your very own Bokeh application filled with interactive and visually aesthetic plots.
Table of Contents (10 chapters)

Verifying your installation

Once you have installed Bokeh, you will want to verify that it is correctly installed. In order to verify the installation and create all your Bokeh plots, you'll need a Jupyter Notebook. If you are not familiar with working with a Jupyter Notebook before or have installed, the following link will provide you with a step-by-step tutorial on how to install and work with Jupyter Notebook: http://jupyter.org/install.

You can verify your installation of Bokeh by generating a simple line plot using a Jupyter Notebook with the following code:

from bokeh.plotting import figure, output_file, show

#HTML file to output your plot into
output_file("bokeh.html")

#Constructing a basic line plot

x = [1,2,3]
y = [4,5,6]

p = figure()

p.line(x,y)

show(p)

This should open up a new tab on your browser with a plot illustrated as follows:

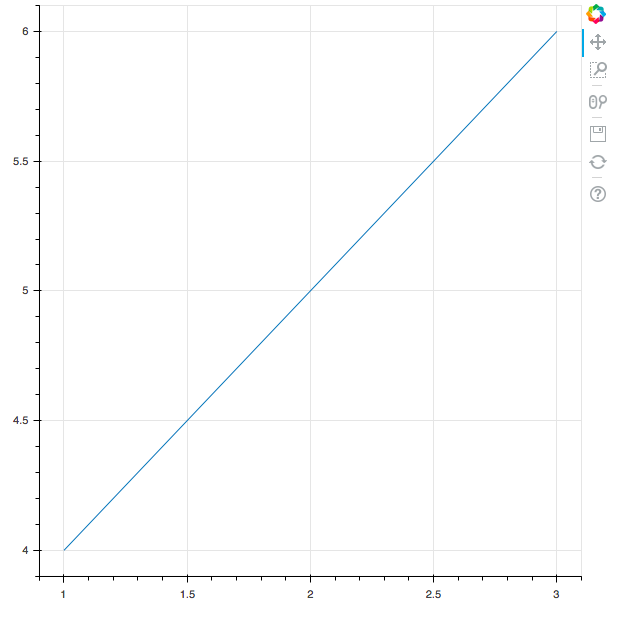
Don't worry too much about what the code does for now. If you have got the preceding plot, you should be satisfied that Bokeh has been successfully installed on your local machine.