

Considering areas that can slow you down
The next step in our performance management journey is to understand where time is spent. A Power BI solution is ultimately about exposing data to a user and can be thought of as a flow of data from source systems or data stores, through various Power BI system components, eventually reaching a user through a computer or mobile device. A simplified view of a Power BI solution is presented in Figure 1.2:
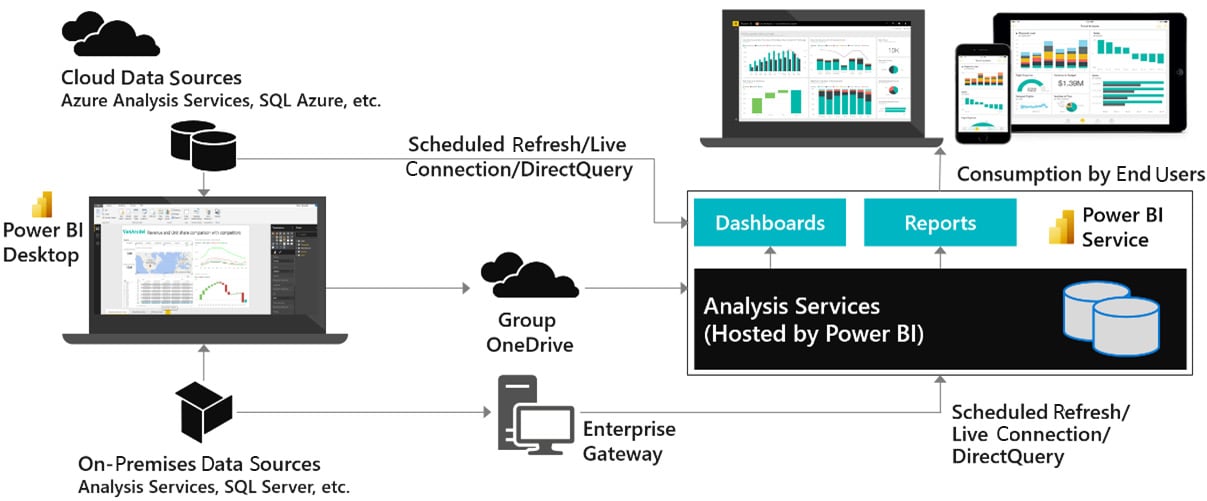
Figure 1.2 – Simplified overview of a Power BI solution
Next, we will briefly focus on the different parts of a typical solution to explain why each piece has important considerations for users and the effect poor performance can have. Some of these areas will be covered in more detail in Chapter 2, Exploring Power BI Architecture and Configuration.
Connecting data sources
The following diagram highlights the areas of the solution that are affected when data sources and connectivity methods do not perform well:
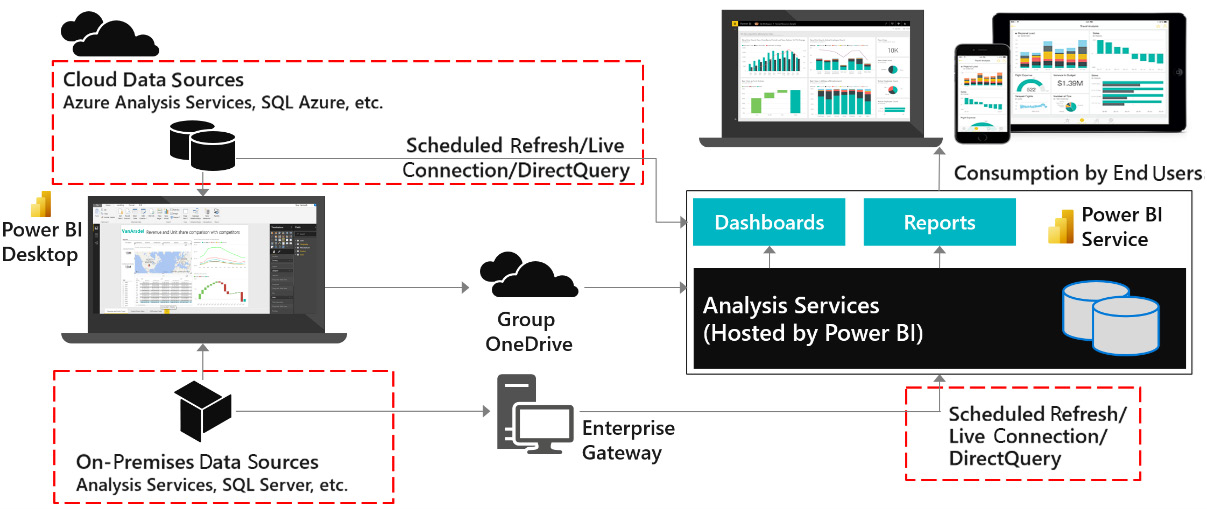
Figure 1.3 – Areas affected by data source and connectivity issues
Import mode
When using Import mode datasets, developers can experience sluggish user interface responsiveness when working with Power Query or M in Power BI Desktop. In extreme cases, this can extend data transformation development from hours to days. Once the solution is deployed, problems in this area can cause refresh times to extend or fail. The Power BI service has a refresh limit of 2 hours, while Power BI Premium extends this to 5 hours. Any refresh hitting this time limit will be canceled by the system.
DirectQuery mode
DirectQuery mode leaves the data at the source and needs to fetch data and process it within Power BI for almost every user interaction. Issues with this part of the configuration most often cause slow reports for users. Visuals will take a longer time to load, and users may get frustrated and then interrupt and interact with other views or filter conditions. This itself can issue more queries and ironically slow down the report even further by placing additional load on the external source system.
Live connection mode
Live connection mode originally referred exclusively to connections to external Analysis Services deployments, which could be cloud-native (Azure Analysis Services) or on-premises (SQL Server Analysis Services). More recently, this mode was extended to more use cases with the introduction of shared datasets and the ability to connect Power BI Desktop to build a report against a published dataset in the Power BI service. Since the underlying dataset could be Import or DirectQuery mode, the experience may vary as described in previous sections.
The Power BI enterprise gateway
The Power BI gateway is a middleware component used to connect to external data sources. It is usually part of the same physical or virtual network, and it establishes a secure outgoing connection to Power BI, over which it can send data to satisfy report queries and data refresh requests.
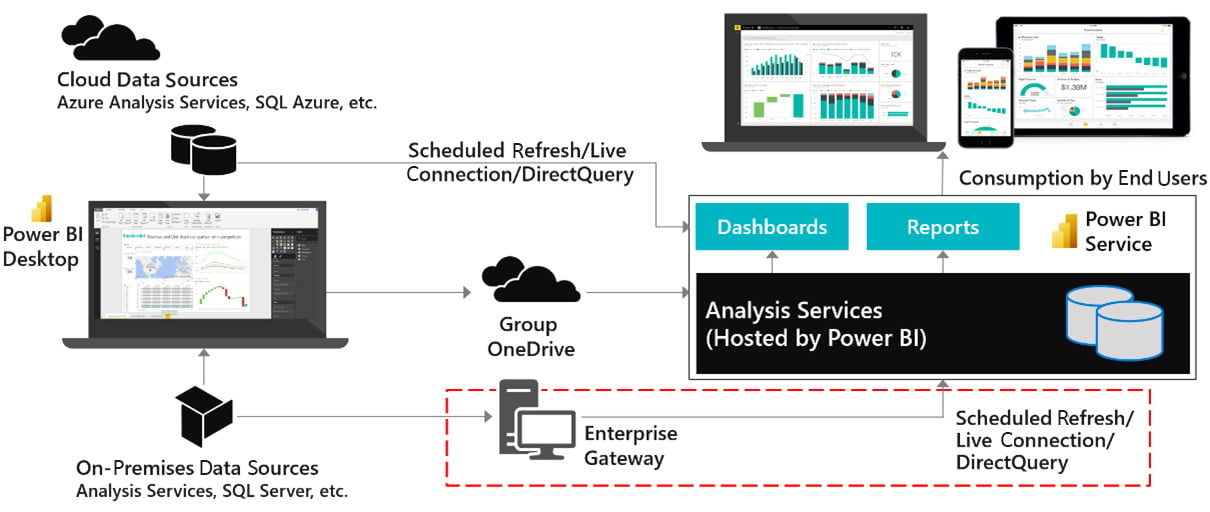
Figure 1.4 – Power BI enterprise gateway
The gateway is not just a conduit for data, which is a common misconception. In addition to providing authenticated and approved connections to data sources, it contains the mashup engine that performs data transformations and compresses data before sending it to the Power BI service. When the gateway is not optimized it can lead to long-running data refreshes, data refresh failures, slow report interactions, or visuals failing to load due to query timeouts.
Network latency
Network latency is about how long a piece of information takes to travel from one point to another in a network. Network latency is measured in milliseconds and is typically measured by performing a ping. A ping measures the time taken to send a small packet of information to a destination and receive a response acknowledging the message. Ping times that reach seconds can be problematic. The main drivers of network latency are geographical distance, the number of hops the information needs to take on the way, and how busy the networks are overall.
The following diagram highlights the possible paths that data takes within Power BI. It's worth noting that each individual arrow could have different latency, which means effects can be felt disproportionately by certain users or in certain parts of the solution.
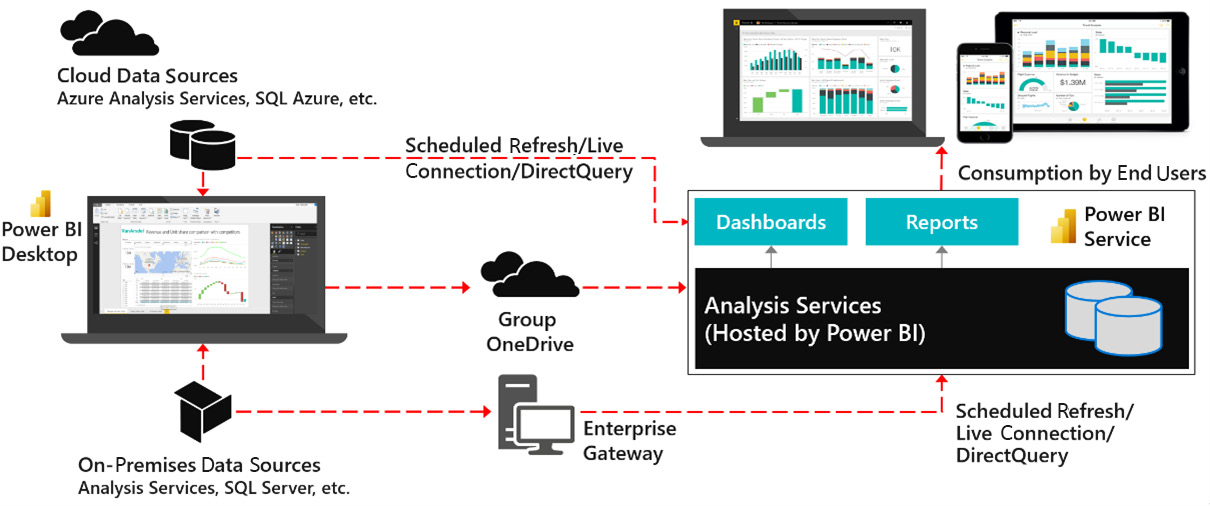
Figure 1.5 – Data movement affected by network latency
High network latency is most felt when users are interacting with reports. It is a significant contributor of slow performance primarily when there are many visuals in a report and therefore many queries to be executed. This is because such configurations require many individual pieces of information to be sent and received, and each one is affected by the latency.
The Power BI service
The Power BI service is the central part of any Power BI solution. The system components in the service are largely out of the control of developers and users. The stability and performance of these are monitored by Microsoft. The exception is Power BI Premium and Embedded, where the underlying infrastructure is still managed by Microsoft, but your administrators have many choices available on how to manage their dedicated capacity. This will be covered in detail in Chapter 13, Optimizing Premium and Embedded Capacities.
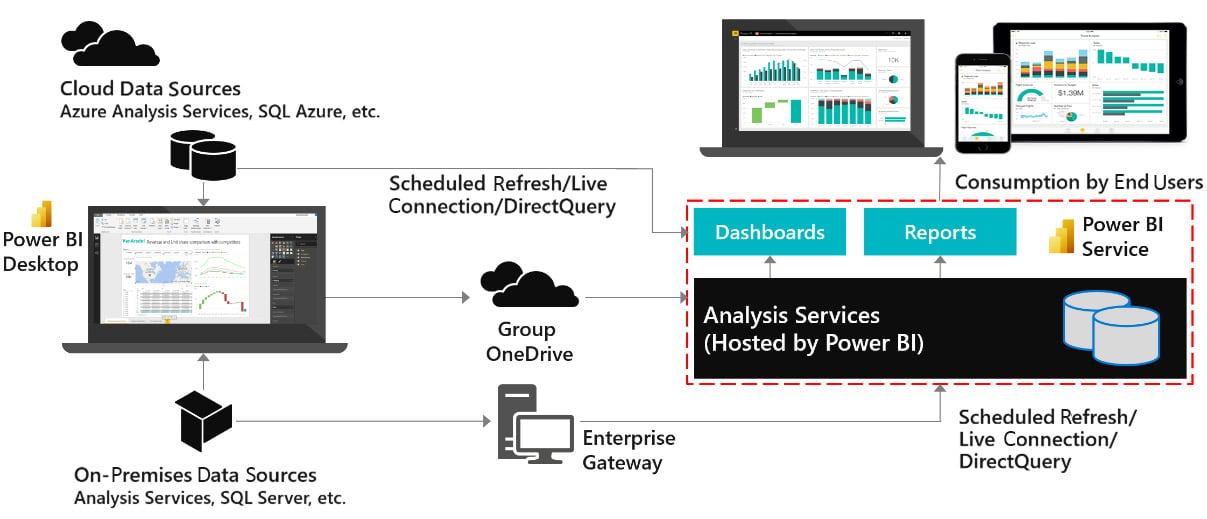
Figure 1.6 – The Power BI service
The major component of the Power BI service that is under your control is the Analysis Services engine, which sits at the core of any Power BI solution. Even with the Power BI service running efficiently under Microsoft's management, poor design choices related to Analysis Services data modeling and DAX calculations can lead to very large datasets, high memory usage, and slow query execution. This generally translates to slow reports. On Premium/Embedded capacities Analysis Services issues can have an exponential effect because they can affect multiple datasets on the capacity.
The final section of this chapter identifies specific areas in Power BI where you can achieve the same result with different design patterns. The choices you make here can affect performance.