-
Book Overview & Buying
-
Table Of Contents

Oracle APEX Cookbook : Second Edition - Second Edition
Oracle APEX Cookbook : Second Edition
Overview of this book
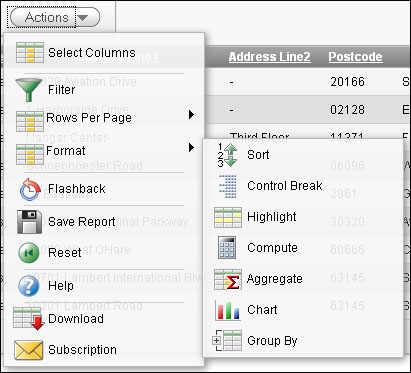
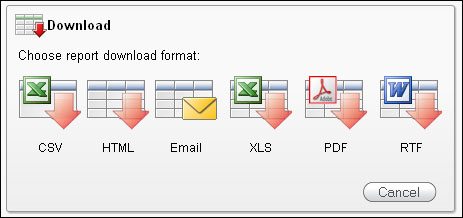
As a Cookbook, this book enables you to create APEX web applications and to implement features with immediately usable recipes that unleash the powerful functionality of Oracle APEX 4.2. Each recipe is presented as a separate, standalone entity and the reading of other, prior recipes is not required.It can be seen as a reference and a practical guide to APEX development.This book is aimed both at developers new to the APEX environment and at intermediate developers. More advanced developers will also gain from the information at hand.If you are new to APEX you will find recipes to start development and if you are an experienced user you will find ways to improve your productivity and efficiency and make the most of APEX to enhance your applications.A little knowledge of PL/SQL, HTML and JavaScript is assumed.
Table of Contents (16 chapters)
Preface

 Free Chapter
1. Creating a Basic APEX Application
2. Themes and Templates
3. Extending APEX
4. Creating Websheet Applications
5. APEX Plug-ins
6. Creating Multilingual APEX Applications
7. APEX APIs
8. Using Web Services
9. Publishing from APEX
10. APEX Environment
11. APEX Administration
12. Team Development
13. HTML5 and CSS3
14. Mobile
Index