-
Book Overview & Buying
-
Table Of Contents
-
Feedback & Rating
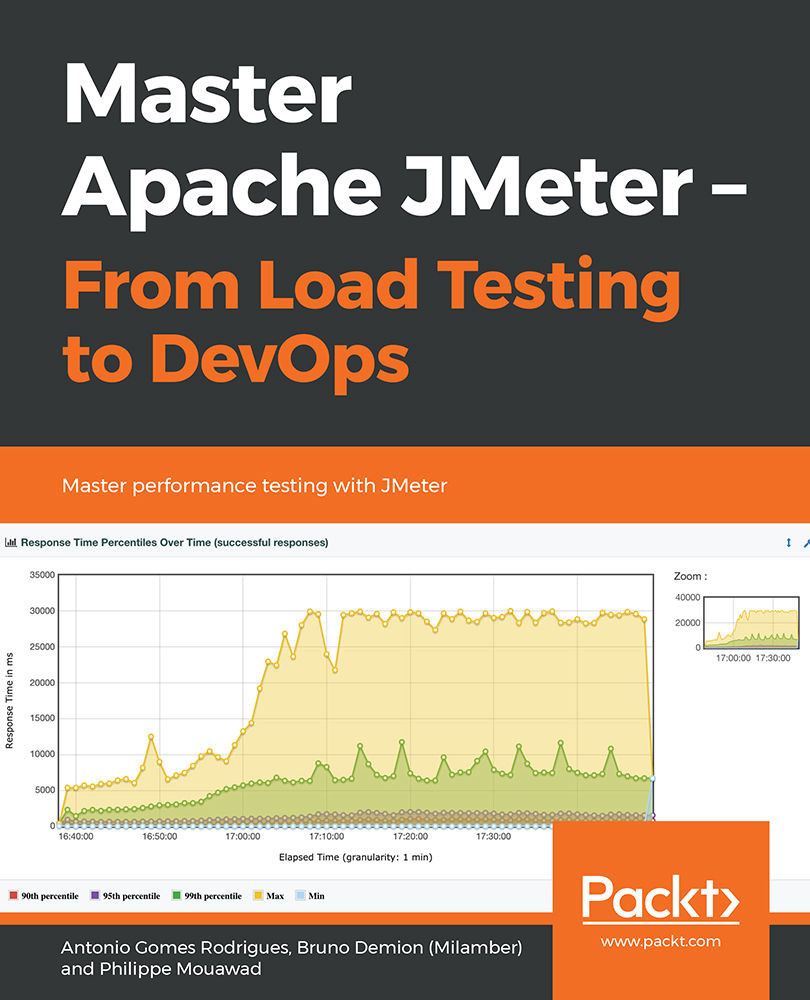
Master Apache JMeter - From Load Testing to DevOps
By :
With JMeter, you can quickly run your first load test. This chapter will show you how to set up a simple test case with JMeter and its HTTP(S) Test Script Recorder element.
Here are the steps to set up our test:


With this trick, we will share these two fields in every element HTTP Request Defaults and JMeter will not put them in each HTTP Request during recording.
During the load test, you should avoid having the injector (JMeter) on the same server as the application under test.
Otherwise, the injected load will be impacted by the application's bad performance, and the application could be impacted by the injector's bad performance.
Our tree is ready; we must now start the proxy server of JMeter.
But before doing that, let's look at the HTTP(S) Test Script Recorder element.
Transaction name, which allows you to fully name them as you wish.
Prefix, which will just prepend the prefix to the default name given by JMeter, which is usually the URL path.

JMeter is now ready to record our navigation session.


When recording a local application, be careful to delete localhost and 127.0.0.1 from the No Proxy for: field.
Now, let's start our navigation session.

Note that the default listening port of JMeter proxy server is 8888.
Note the first time you start the recorder, it takes more time as it generates a Certificate Authority that you can use to intercept HTTPS traffic.

From the browser, navigate to the website:
http://server:8080/examples/servlets/
In our case, it will be:
http://localhost:8080/examples/servlets/
Here is the first page:


Enter first and last name and click on Submit Query:

When the result appears, we can stop our navigation session:


This will allow us to change the URL and port of the tested site in only one location (HTTP Request Defaults) if necessary (for example, if the script was run on a development environment, and the final test will run on the pre-production environment):


The result of the renaming:


Field to Test: Text Response
Pattern Matching Rules: Substring (default)
Patterns to Test: Let's click on the Add button, then insert text contained in the answer:


In the end, we get this JMeter scenario tree:
Now our scenario is ready, let's proceed to the validation of our script.

Number of Threads (users): 10
Ramp-Up Period (in seconds): 10
Loop Count: 100
This gives 10 virtual users (VU) who arrive in 10 seconds (1 per second), and each one will make 100 executions of the query sequence.

Several strategies for setting the load test exists. This point will be discussed deeply in Chapter 2, JMeter Overview.
This ensures that if we get bad response times, the cause is the application being tested and not JMeter.
Note that this is not specific to JMeter but should be done regardless of the tool you use.
An easy and quick solution to monitor JMeter can be to use the Servers Performance Monitoring plugin from the JMeter Plugins (https://jmeter-plugins.org/wiki/PerfMon/).

In the samplersRegex field, we can use a regular expression to keep only the queries that were recorded by the HTTP(S) Test Script Recorder element (thanks to Prefix: field).
For this, we will use the following command line:
<JMETER_HOME>/bin/jmeter -n -t [jmx file] -l [results file] -e -o [Path\ to output folder]
In our terminal:

We can use this dashboard, too: https://grafana.com/dashboards/5496.


The icing on the cake is a CSV file we get at the end of our test; this format is usable by many tools to visualize the results differently.
In this chapter, we have seen how to quickly get started with JMeter to perform a simple load test.
Change the font size
Change margin width
Change background colour