-
Book Overview & Buying

-
Table Of Contents

Zed Attack Proxy Cookbook
By :
Zed Attack Proxy Cookbook
By:
Overview of this book
Maintaining your cybersecurity posture in the ever-changing, fast-paced security landscape requires constant attention and advancements. This book will help you safeguard your organization using the free and open source OWASP Zed Attack Proxy (ZAP) tool, which allows you to test for vulnerabilities and exploits with the same functionality as a licensed tool. Zed Attack Proxy Cookbook contains a vast array of practical recipes to help you set up, configure, and use ZAP to protect your vital systems from various adversaries. If you're interested in cybersecurity or working as a cybersecurity professional, this book will help you master ZAP.
You’ll start with an overview of ZAP and understand how to set up a basic lab environment for hands-on activities over the course of the book. As you progress, you'll go through a myriad of step-by-step recipes detailing various types of exploits and vulnerabilities in web applications, along with advanced techniques such as Java deserialization.
By the end of this ZAP book, you’ll be able to install and deploy ZAP, conduct basic to advanced web application penetration attacks, use the tool for API testing, deploy an integrated BOAST server, and build ZAP into a continuous integration and continuous delivery (CI/CD) pipeline.
Table of Contents (14 chapters)
Preface

Chapter 1: Getting Started with OWASP Zed Attack Proxy
 Free Chapter
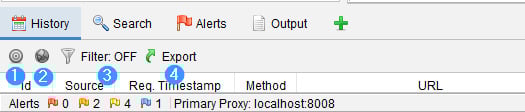
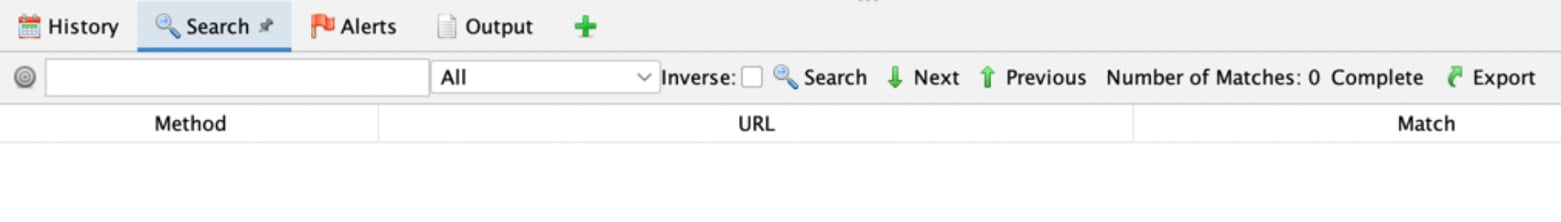
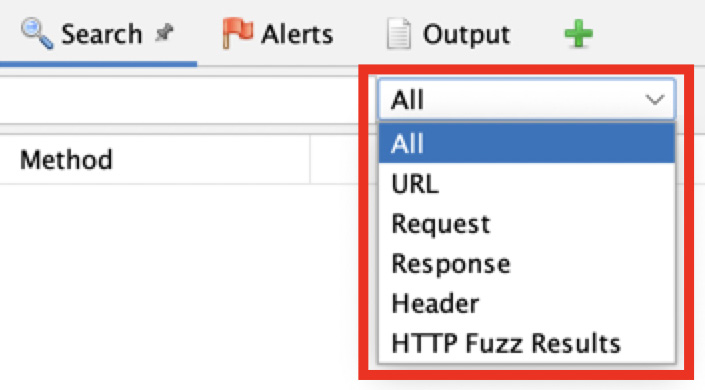
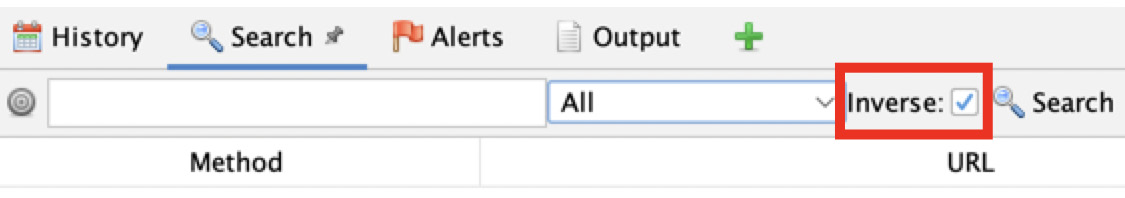
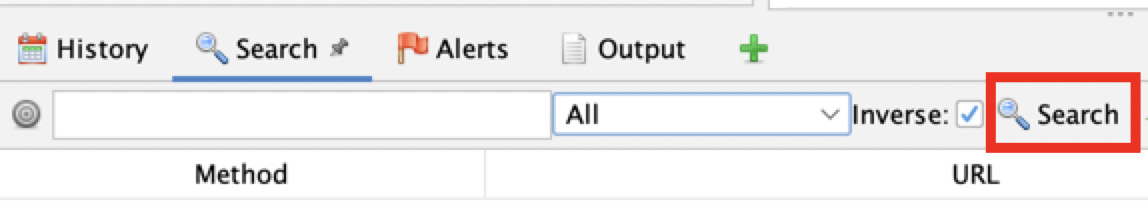
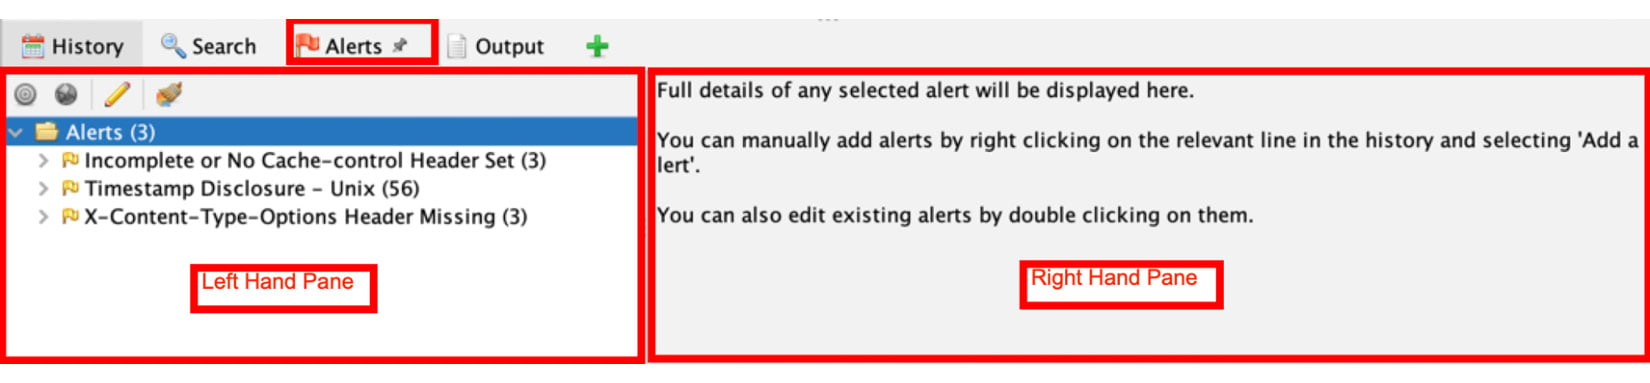
Chapter 2: Navigating the UI
Chapter 3: Configuring, Crawling, Scanning, and Reporting
Chapter 4: Authentication and Authorization Testing
Chapter 5: Testing of Session Management
Chapter 6: Validating (Data) Inputs – Part 1
Chapter 7: Validating (Data) Inputs – Part 2
Chapter 8: Business Logic Testing
Chapter 9: Client-Side Testing
Chapter 10: Advanced Attack Techniques
Chapter 11: Advanced Adventures with ZAP
Index