

Understanding Suricata rules
Suricata is powerful when you have a set of powerful rules. Although there are thousands of Suricata rule templates available online, it is still important to learn how to create a custom Suricata rule from scratch. In this section, we’ll learn basic Suricata rule syntax and some common use cases with attack and defense.
Suricata rule syntax
Suricata uses rules to detect different network events, and when certain conditions are met, it can be set up to do things such as alert or block.
Here’s an overview of the Suricata rule syntax:
action proto src_ip src_port -> dest_ip dest_port (msg:"Alert message"; content:"string"; sid:12345;)
Let’s break this code down:
action: This says what should be done when the rule is true. It can bealertto send an alert,dropto stop the traffic, or any of the other actions that are supported.proto: This shows what kind of traffic is being matched, such astcp,udp, andicmp.src_ip: This is the source IP address or range of source IP addresses. This is where the traffic comes from.src_port: This is the port or range of ports where the traffic is coming from.dest_ip: This is the IP address or range of IP addresses where the traffic is going.dest_port: This is the port or range of ports where the traffic is going.msg: The message that will be shown as an alert when the rule is true.content: This is an optional field that checks the packet payload for a certain string or content.
Now, based on our current Suricata configuration, we have the $HOME_NET and $EXTERNAL_NET network variables. Let’s get an understanding of an example rule to detect an SSH connection:
alert tcp $EXTERNAL_NET any -> $HOME_NET 22 (msg:"SSH connection detected"; flow:to_server,established; content:"SSH-2.0-OpenSSH"; sid:100001;)
Let’s break this down:
alert: The rule specifies that an alert should be generated if the specified conditions are met.tcp: This refers to Transmission Communication Protocol (TCP) based traffic.$EXTERNAL_NET any -> $HOME_NET 22: The traffic flow is defined by directing traffic from any external network IP address ($EXTERNAL_NET) to any home or local network IP ($HOME_NET) on port22(SSH).(msg:"SSH connection detected";): This specifies a detailed message to be added to the alert. It indicates that the rule has identified an SSH connection in this instance.flow:to_server,established: This defines the direction of the traffic that initiates the rule. It is looking for established connections between the server (home network) and the server (external network). This portion of the rule prevents initial connection attempts from generating alerts.content:"SSH-2.0-OpenSSH: This part looks at the payload of the packet for a particular string ("SSH-2.0-OpenSSH"). It searches the traffic payload for this specific string, which signifies the utilization of the OpenSSH protocol and the SSH protocol in general.sid:100001: It is a unique identifier for a particular rule.
Now that we’ve learned how to create some basic Suricata rules, let’s go through some Suricata IDS use cases with the Wazuh platform.
Network scanning probe attack and detection
Network scanning is the initial stage of most hacking exercises, and the most powerful tool used for this purpose is none other than the Nmap scanner. Nmap is a free and open source Linux command-line tool. Nmap helps us to scan any host to discover opened ports, software versions, OSs, and so on. It is used by security professionals for security testing, network exploration, and vulnerability detection. Threat actors also perform network scanning to discover any open ports, software versions, or vulnerability packages. In this section, we will initiate network scanning probes using the Nmap tool against our Wazuh agent (running Suricata services). The ET ruleset already consists of rules to detect Nmap-based scanning probes. We will verify it using this attack scenario.
We will be following the points in these sections:
- Lab setup
- Attack simulation
- Visualize on the Wazuh manager
Lab setup
In this mini lab setup, we need three parts: an attacker machine (Kali Linux or Ubuntu), an Ubuntu machine or Windows machine with the Wazuh agent installed on it, and finally, our Wazuh server. If you use a Kali Linux machine, Nmap is preinstalled; however, if you use an Ubuntu machine, you can install the Nmap package using the sudo apt-get install nmap command.
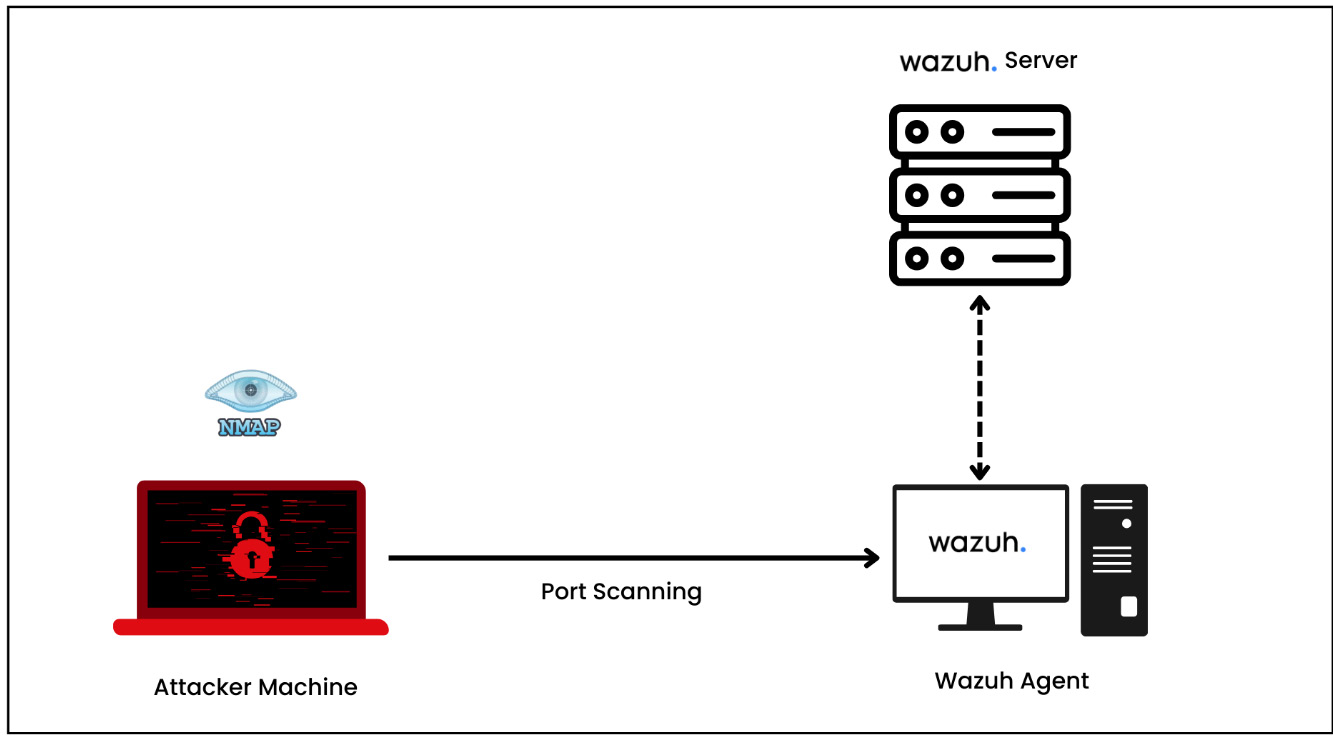
Figure 1.17 – Lab setup of network scanning probe detection using Nmap
Attack simulation
If you are using Kali Linux or Ubuntu as an attacker machine, you can open the terminal and enter the nmap command using the -sS keyword for an SYN scan and -Pn to skip host discovery. The Nmap SYN scan is a half-open scan that works by sending a TCP SYN packet to the target machine (the Wazuh agent). If the port is open, the target device responds with a SYN-ACK (synchronize-acknowledgment) packet. However, if the port is closed, the device may respond with an RST (reset) packet, which means the port is not open. In this testing, we will run two types of scan: first to check for open ports using -sS and second, to check for software version using -sV (version scan):
# nmap -sS -Pn 10.0.2.5. // Port Scanning
# nmap -sS -sV -Pn 10.0.2.5 // Version Scanning
Once you run the preceding command, you will learn what all the ports are open and second, what version of the package is installed on the target machine. Let’s look at the output of the Nmap port scan command:
nmap -sS -Pn 10.0.2.5
Starting Nmap 7.94 ( https://nmap.org ) at 2023-12-10 02:53 IST
Nmap scan report for 10.0.2.5
Host is up (0.0037s latency).
Not shown: 998 closed tcp ports (reset)
PORT   STATE SERVICE
22/tcp open  ssh
80/tcp open  http
Nmap done: 1 IP address (1 host up) scanned in 1.45 seconds
As you can see, STATE of port 22/tcp and 80/tcp are open. Now, let’s look at the output of the Nmap version check command:
nmap -sV -Pn 10.0.2.5
Starting Nmap 7.94 ( https://nmap.org ) at 2023-12-10 02:59 IST
Nmap scan report for 10.0.2.5
Host is up (0.0024s latency).
Not shown: 998 closed tcp ports (reset)
PORT   STATE SERVICE VERSION
22/tcp open  ssh     OpenSSH 8.9p1 Ubuntu 3ubuntu0.3 (Ubuntu Linux; protocol 2.0)
80/tcp open  http    Apache httpd 2.4.52 ((Ubuntu))
Service Info: OS: Linux; CPE: cpe:/o:linux:linux_kernel
Service detection performed. Please report any incorrect results at https://nmap.org/submit/ .
Nmap done: 1 IP address (1 host up) scanned in 7.59 seconds
From the output, you can see from the VERSION column that the target is running two software packages: OpenSSH 8.9 and Apache with version 2.4.52.
Visualize on the Wazuh dashboard
To visualize the Suricata alerts, log in to the Wazuh manager and navigate to Security events. Next, select the agent. You will find the security alert shown in the following diagram.
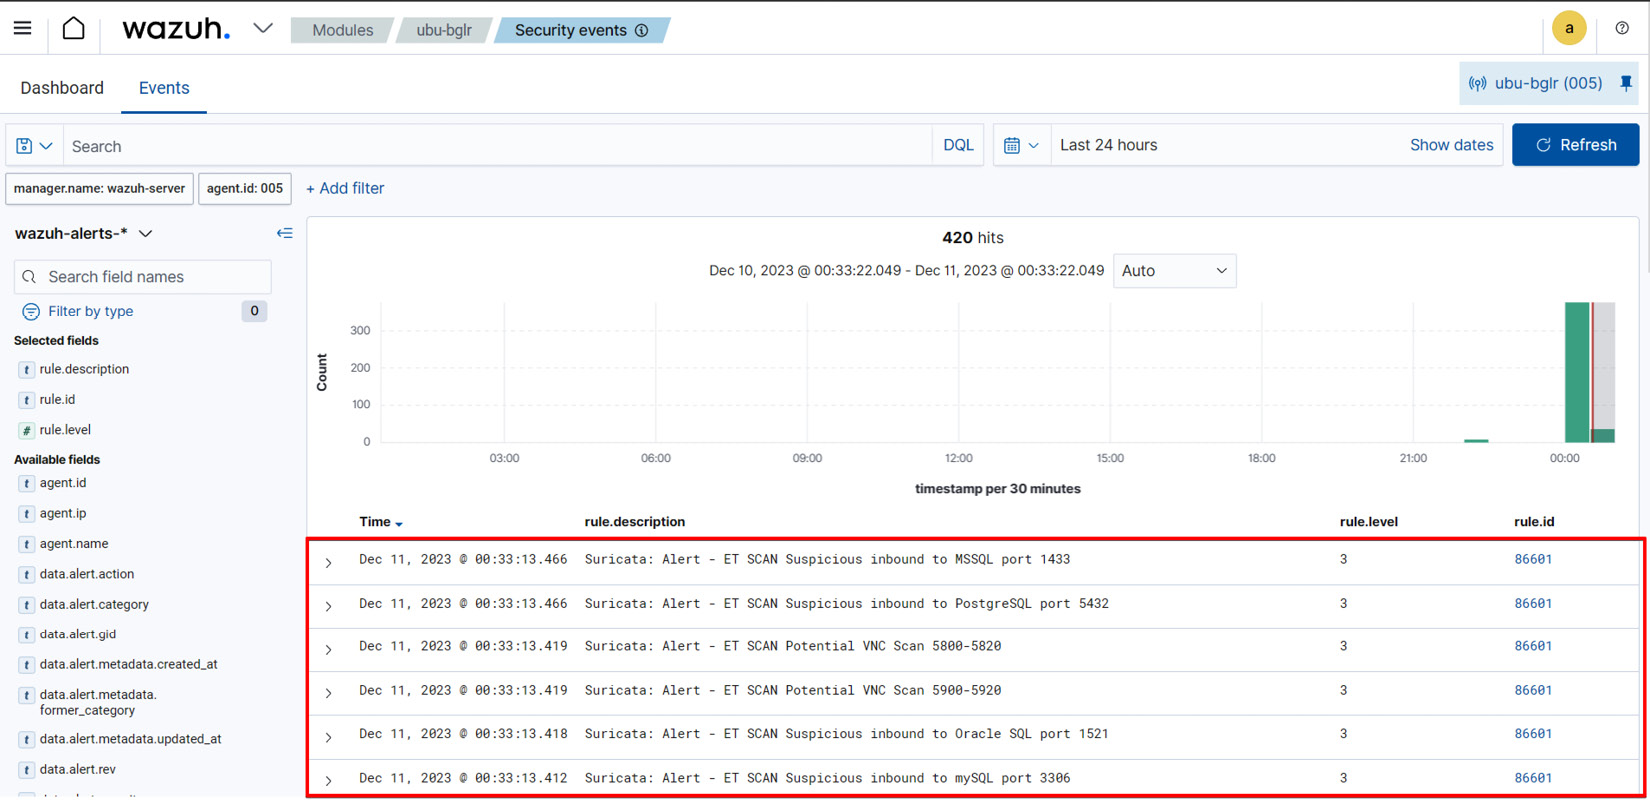
Figure 1.18 – Visualizing network scanning probes on the Wazuh dashboard
You can also apply a filter with rule.group: suricata.
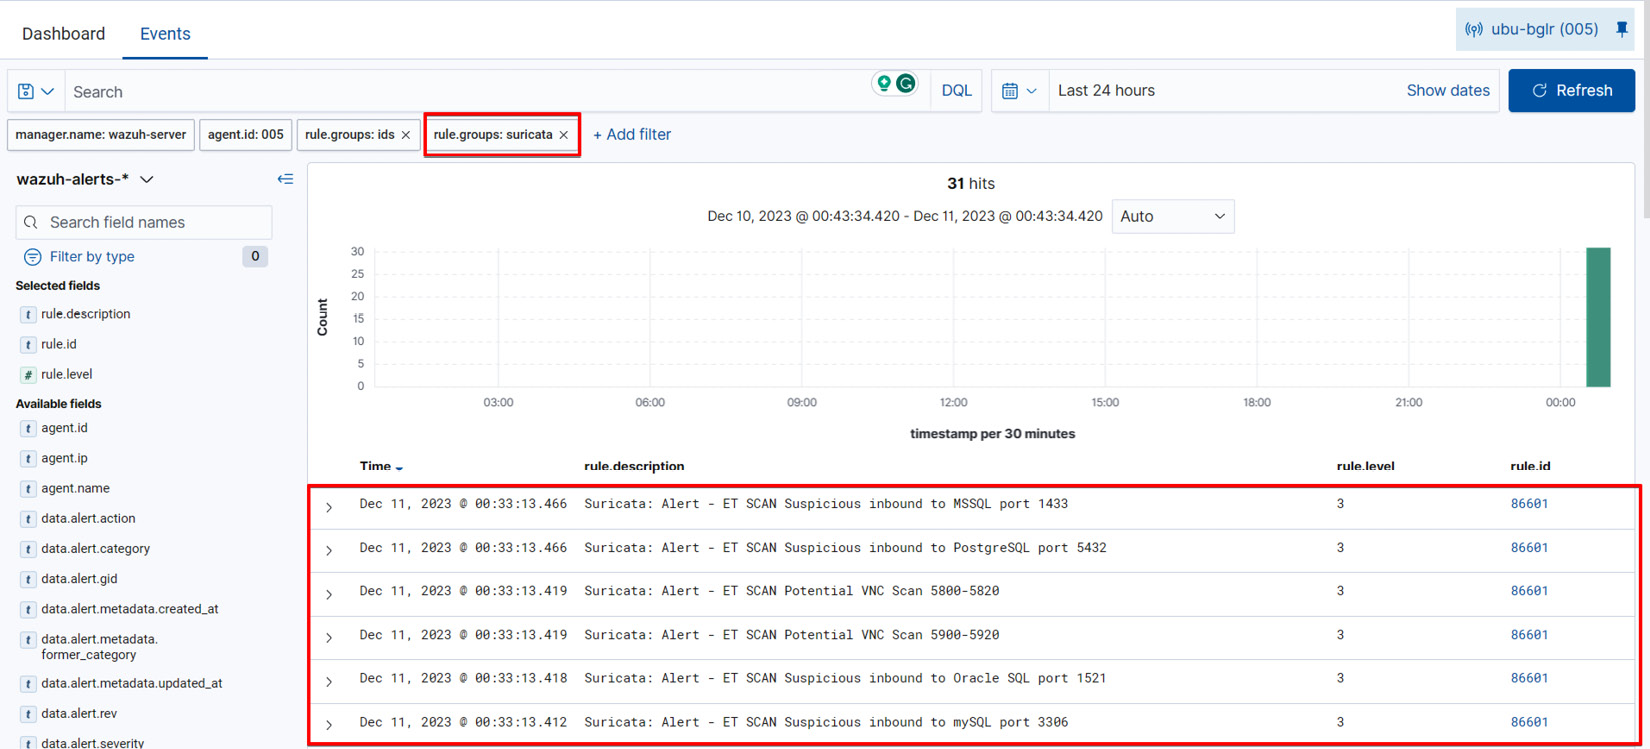
Figure 1.19 – Visualizing network scanning probes using a Suricata filter
Let’s expand one of the alerts, as shown in the following.
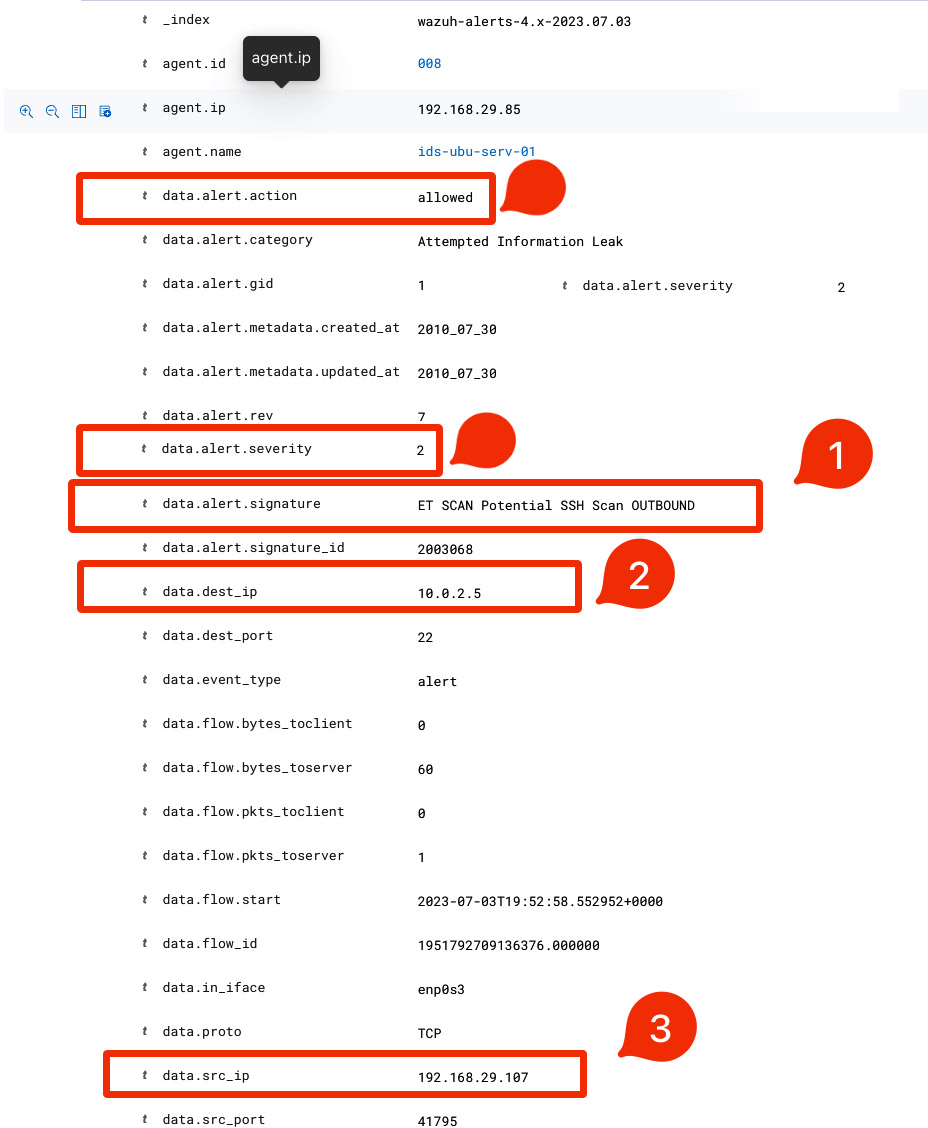
Figure 1.20 – The ET SCAN Potential SSH Scan OUTBOUND alert
Let’s break some of the following down:
data.alert.signature: This field talks about theET SCAN Potential SSH Scan OUTBOUNDSuricata rule that detected this abnormal traffic.ETrepresents the ET ruleset.data.dest_ip: This gives us the victim IP address.data.src_ip: This gives us the attacker IP address.data.alert.action: This field indicates the action taken by Wazuh in response to a detected security event.alerts.severity: This field represents the severity level assigned to the security event by Wazuh.
So, this was the simple use case of how Suricata can detect the network scanning probes and how Wazuh visualizes it on the dashboard. In the next section, we will learn how to detect web-based attacks on our intentionally vulnerable application DVWA.