-
Book Overview & Buying
-
Table Of Contents

Microsoft AJAX Library Essentials: Client-side ASP.NET AJAX 1.0 Explained
By :
Microsoft AJAX Library Essentials: Client-side ASP.NET AJAX 1.0 Explained
By:
Overview of this book
Microsoft AJAX Library Essentials is a practical reference for the client-side library of the ASP.NET AJAX Framework 1.0, and a tutorial for the underlying technologies and techniques required to use the library at its full potential. The main goal of this book is to get you comfortable with the Microsoft AJAX Library, a huge set of functions that can be used for developing powerful client-side functionality.Beginning with a hands-on tour of the basic technologies associated with AJAX, JavaScript, XMLHttpRequest, JSON, and the DOM, you'll move on to a crash course in the Microsoft AJAX tools. You will learn, through numerous step-by-step exercises, how to create basic AJAX applications, how the object-based programming model of JavaScript works, and how Microsoft AJAX Library extends this model. You'll understand the architecture of the Microsoft AJAX components, how they all fit together, and exactly what they can do for you. Then you will learn how to use the Microsoft AJAX Library in your web projects, and a detailed case study will walk you through creating your own customized client components. At every stage of your journey, you'll be able to try out examples to illuminate the theory, and consolidate your understanding. In addition to learning about the client and server controls, you'll also see how to handle errors and debug your AJAX applications.To complement your new found skills, the book ends with a visual reference of the Microsoft AJAX Library namespaces and classes, including diagrams and quick explanations for all the classes mentioned in the book, providing an invaluable reference you will turn to again and again.
Table of Contents (14 chapters)
Copyright

Credits
About the Authors
About the Reviewers
Preface
 Free Chapter
AJAX and ASP.NET
AJAX Foundations
Object-Oriented JavaScript
Introducing the Microsoft AJAX Library
OOP with the Microsoft AJAX Library
Creating Client Components
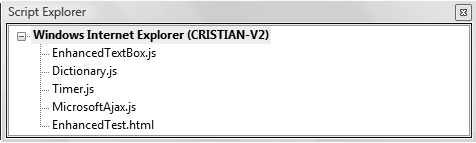
Case Study: Timer and EnhancedTextBox
Debugging Tools and Techniques