

You may yet follow all of the rules for optimal performance and still find yourself with a slow application. When this happens, you need to become adept at assessing load times and profiling your application. Fortunately, there are many tools available to help pinpoint the bottlenecks; these tools are explained in the coming sections.
All of the major browsers include a network tab that will graphically display all of the requests and responses between the browser and the servers it contacts. Firefox includes a Net tab as part of the Firebug add-on as shown in the following screenshot:
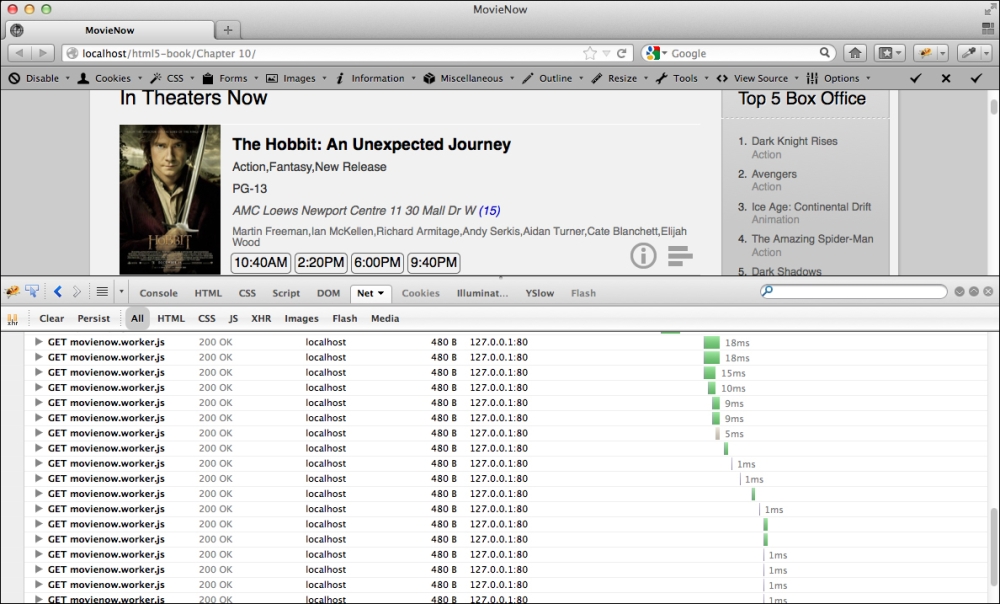
It displays a set of bars that indicate load time per request over time. Here you can see the web page loading piece-by-piece including how it loads the HTML first and then requests the ancillary assets afterward: image files, CSS files, JavaScript files, and even subsequent AJAX requests. As you can see in the following screenshot, when you hover over each bar, you will see...