

During the development of an eZ Publish site, it is very important to have immediate feedback about what we are doing. The CMF gives us a couple of debuggers to help us in our task. These are the code debugger and the template debugger.
eZ Publish includes a wrapper for all of the errors returned by PHP, which will display the errors at the bottom of our page, or in a new page if we prefer. When we release a site, it's very important that all of the errors are fixed, in order to avoid bad surprises or a slowdown of the application.
To use the debugging capabilities of the system, we have to edit the site.ini file of the global siteaccess, and enable the DebugOutput parameter.
[DebugSettings]
DebugOutput=enabled
After we enable this setting and empty the cache, we will see the debugger, as shown in the following screenshot:
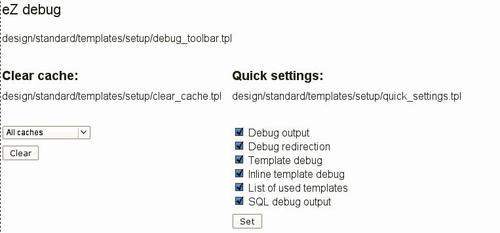
On this page, we can see some utils that are used to clear the cache and enable different kinds of debug, such as the loading the .ini files, the execution of the queries, or the template rendering time.
Moreover, this parameter will enable some special operators for the template that will allow us to print the HTML output of the page, and the values of the variables used.
The most important operators for debugging are debug-log, debug-timing-point, and debug-accumulator. These operators allow us to see particular information about how much time our code needs to run, and the values of the instantiated variables. We will look at the operators one by one.
This operator will perform a PHP var_dump of objects, arrays, and strings. This means that you'll be able to see what a particular object contains in the current page.
{debug-log var=$object msg='object contents'}
{debug-log msg='hello world'}
{debug-log var=array(1,2,3)}
This particular operator will give us the ability to analyze the time needed to execute a certain block of code.
{debug-timing-point id=""}
{$item} - {$item2}
{/debug-timing-point}
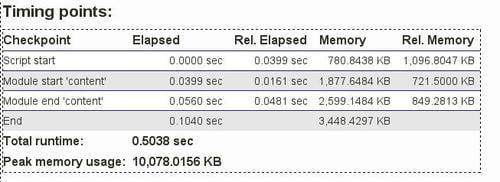
As we can see in the above screenshot, you can truncate your code with some checkpoints to see which parts of your templates are the most time-consuming.
The debug-accumulator template function executes the body and generates the statistics. The number of calls, total time, and average time will be shown in the debugger.
{debug-accumulator}
{section var=error loop=$errors}{$error}{/section}
{/debug-accumulator}
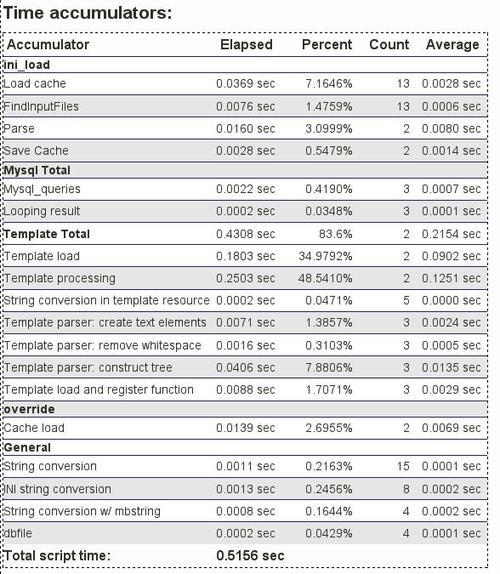
This operator is quite useful when we want to have a complete view of how complex the pages are and the resources that they need, such as MySQL query timing.
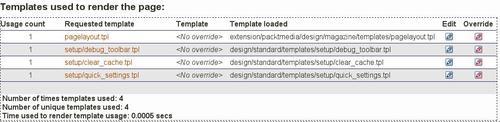
Using the debugger of the templating system, we should be able to know:
The list of the templates and sub-templates loaded into the displayed page
The number of these templates
The total number of loaded templates, if some templates are loaded more than once
To enable this debugger, as shown in the previous screenshot, we have to enable the debugOutput option, as seen before. Next, we have to enable the ShowUsedTemplates setting of the TemplateSettings, in the same site.ini file.
[TemplateSettings]
...
ShowUsedTemplates=enabled
...
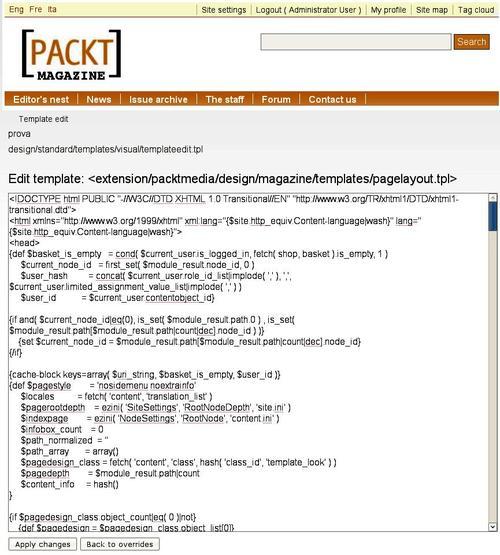
Moreover, by enabling this kind of debug, we'll be able to edit the templates by clicking on the relative edit button. You can see this in the following screenshot:
Now, we can enable the verbose debugger output, by using the Debug parameter, and then render the inline of the name of the loaded template in the HTML page, by using the ShowXHTMLCode parameter.
[TemplateSettings]
...
Debug=enabled
ShowXHTMLCode=enabled
...
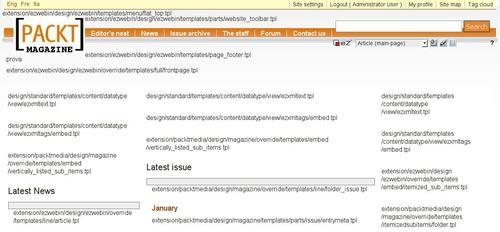
When ShowXHTMLCode is enabled, eZ publish will display a comment in the rendered output of the browser each time a new template is loaded, as shown in the previous screenshot.