
Earlier (in this chapter), we said that a search delivers the content of each dashboard panel. A dashboard panel can be one of the several content types. Here, we will take a look at examples of each.
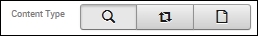
When you add a (new) panel to an existing dashboard, you get to select the panel's content type simply by clicking on the appropriate icon, as shown in the following screenshot:
Dashboard panels can use live, inline searches as the source for the content displayed in the panel. Once you have added a panel to your dashboard, you can click on the panel edit icon and then select Edit Search String. In the Edit Search dialog, edit the Splunk search pipeline, select Time Range, and then click on Save, as shown here:
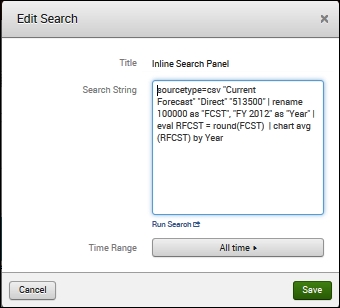
The Edit Search dialog box