

IPython has an exciting feature—the web notebook. A so-called notebook server can serve notebooks over the Web. We can now start a notebook server and get a web-based IPython environment. This environment has most of the features that the regular IPython environment has. The IPython notebook's features include the following:
Displaying images and inline plots
Using HTML and Markdown (this is a simplified HTML-like language see https://en.wikipedia.org/wiki/Markdown) in text cells
Importing and exporting of notebooks
Before we start, we should make sure that all of the required software is installed. There is a dependency on tornado and zmq. See the Installing IPython recipe in this chapter for more information.
Running a notebook: We can start a notebook with the following command:
$ ipython notebook

[NotebookApp] Using existing profile dir: u'/Users/ivanidris/.ipython/profile_default'
[NotebookApp] The IPython Notebook is running at: http://127.0.0.1:8888
[NotebookApp] Use Control-C to stop this server and shut down all kernels.
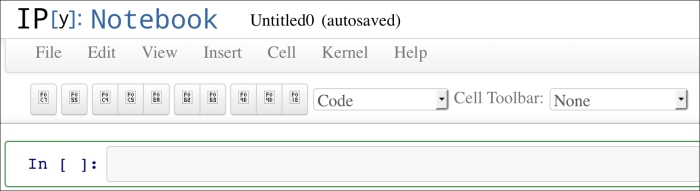
As you can see, we are using the default profile. A server started on the local machine at port 8888. You will learn how to configure these settings later on in this chapter. The notebook is opened in your default browser; this is configurable as well (see the following screenshot):

IPython lists all the notebooks in the directory where you started the notebook. In this example, no notebooks were found. The server can be stopped by pressing Ctrl + C.
Running a notebook in the pylab mode: Run a web notebook in the pylab mode with the following command:
$ ipython notebook --pylabThis loads the
SciPy,NumPy, andmatplotlibmodules.Running a notebook with inline figures: We can display inline matplotlib plots with the
inlinedirective using the following command:$ ipython notebook --pylab inlineThe following steps demonstrate the IPython notebook functionality:
Click on the New Notebook button to create a new notebook.
Create an array with the
arange()function. Type the command shown in the following screenshot and click on Cell/Run:
Next enter the following command and press Enter. You will see the output in Out [2], as shown in the following screenshot:

Apply the
sinc()function to the array and plot the result, as shown in this screenshot:

The inline option lets you display inline matplotlib plots. When combined with the pylab mode, you don't need to import the NumPy, SciPy, and matplotlib packages.
The Installing IPython recipe found in this chapter
Example notebooks at http://nbviewer.ipython.org/github/ipython/ipython/blob/2.x/examples/Notebook/Index.ipynb
Documentation for the
sinc()function at http://docs.scipy.org/doc/numpy/reference/generated/numpy.sinc.htmlDocumentation for the
plot()function at http://matplotlib.org/api/pyplot_api.html#matplotlib.pyplot.plot