

Triangulations arise when dealing with spatial locations. Apart from showing distances between points and neighborhood relationships, triangulation plots can be a convenient way to represent maps. matplotlib provides a fair amount of support for triangulations.
As in the preceding examples, the following few lines of code are enough:
import numpy as np
import matplotlib.pyplot as plt
import matplotlib.tri as tri

data = np.random.rand(100, 2)

triangles = tri.Triangulation(data[:,0], data[:,1])

plt.triplot(triangles)
plt.show()
Every time the script is run, you will see a different triangulation as the cloud of points that is triangulated is generated randomly.
The preceding script displays the following graph:
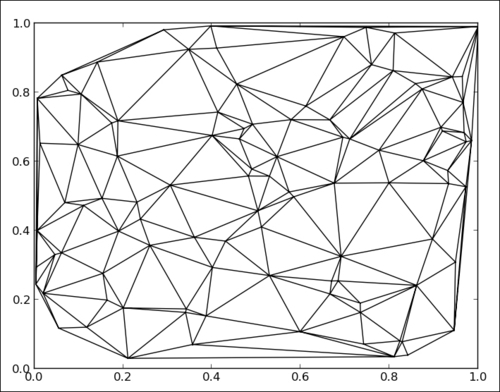
We import the matplotlib.tri module, which provides helper functions to compute triangulations from points. In this example, for demonstration purpose, we generate a random cloud of points using the following code:
data = np.random.rand(100, 2)
We compute a triangulation and store it in the triangles' variable with the help of the following code:
triangles = tri.Triangulation(data[:,0], data[:,1])
The pyplot.triplot() function simply takes triangles as inputs and displays the triangulation result.