Sign In Start Free Trial
Account

Add to playlist

Create a Playlist

Modal Close icon
You need to login to use this feature.
  • Book Overview & Buying matplotlib Plotting Cookbook
  • Table Of Contents Toc
matplotlib Plotting Cookbook

matplotlib Plotting Cookbook

By : Alexandre Devert
3.7 (10)
close
close
matplotlib Plotting Cookbook

matplotlib Plotting Cookbook

3.7 (10)
By: Alexandre Devert

Overview of this book

This book follows a cookbook style approach that puts orthogonal and non-redundant recipes in your hands. Rather than rehashing the user manual, the explanations expose the underlying logic behind Matplotlib. If you are an engineer or scientist who wants to create great visualizations with Python, rather than yet another specialized language, this is the book for you. While there are several very competent plotting packages, Matplotlib is “just” a Python module. Thus, if you know some Python already, you will feel at home from the first steps on. In case you are an application writer, you won't be left out since the integration of Matplolib is covered.
Table of Contents (15 chapters)
close
close
matplotlib Plotting Cookbook
Credits
About the Author
About the Reviewers
www.PacktPub.com
Preface
1
Index

Plotting one curve


The initial example of Hello World! for a plotting software is often about showing a simple curve. We will keep up with that tradition. It will also give you a rough idea about how matplotlib works.

Getting ready

You need to have Python (either v2.7 or v3) and matplotlib installed. You also need to have a text editor (any text editor will do) and a command terminal to type and run commands.

How to do it...

Let's get started with one of the most common and basic graph that any plotting software offers—curves. In a text file saved as plot.py, we have the following code:

import matplotlib.pyplot as plt

X = range(100)
Y = [value ** 2 for value in X]

plt.plot(X, Y)
plt.show()

Tip

Downloading the example code

You can download the sample code files for all Packt books that you have purchased from your account at http://www.packtpub.com. If you purchased this book elsewhere, you can visit http://www.packtpub.com/support and register to have the files e-mailed directly to you.

Assuming that you installed Python and matplotlib, you can now use Python to interpret this script. If you are not familiar with Python, this is indeed a Python script we have there! In a command terminal, run the script in the directory where you saved plot.py with the following command:

python plot.py

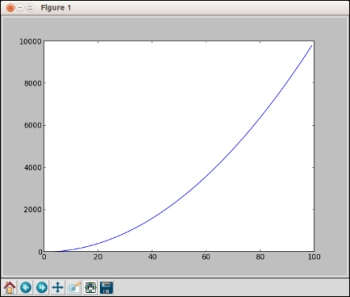
Doing so will open a window as shown in the following screenshot:

The window shows the curve Y = X ** 2 with X in the [0, 99] range. As you might have noticed, the window has several icons, some of which are as follows:

  • : This icon opens a dialog, allowing you to save the graph as a picture file. You can save it as a bitmap picture or a vector picture.
  • : This icon allows you to translate and scale the graphics. Click on it and then move the mouse over the graph. Clicking on the left button of the mouse will translate the graph according to the mouse movements. Clicking on the right button of the mouse will modify the scale of the graphics.
  • : This icon will restore the graph to its initial state, canceling any translation or scaling you might have applied before.

How it works...

Assuming that you are not very familiar with Python yet, let's analyze the script demonstrated in the previous section.

The first line tells Python that we are using the matplotlib.pyplot module. To save on a bit of typing, we make the name plt equivalent to matplotlib.pyplot. This is a very common practice that you will see in matplotlib code.

The second line creates a list named X, with all the integer values from 0 to 99. The range function is used to generate consecutive numbers. You can run the interactive Python interpreter and type the command range(100) if you use Python 2, or the command list(range(100)) if you use Python 3. This will display the list of all the integer values from 0 to 99. In both versions, sum(range(100)) will compute the sum of the integers from 0 to 99.

The third line creates a list named Y, with all the values from the list X squared. Building a new list by applying a function to each member of another list is a Python idiom, named list comprehension. The list Y will contain the squared values of the list X in the same order. So Y will contain 0, 1, 4, 9, 16, 25, and so on.

The fourth line plots a curve, where the x coordinates of the curve's points are given in the list X, and the y coordinates of the curve's points are given in the list Y. Note that the names of the lists can be anything you like.

The last line shows a result, which you will see on the window while running the script.

There's more...

So what we have learned so far? Unlike plotting packages like gnuplot, matplotlib is not a command interpreter specialized for the purpose of plotting. Unlike Matlab, matplotlib is not an integrated environment for plotting either. matplotlib is a Python module for plotting. Figures are described with Python scripts, relying on a (fairly large) set of functions provided by matplotlib.

Thus, the philosophy behind matplotlib is to take advantage of an existing language, Python. The rationale is that Python is a complete, well-designed, general purpose programming language. Combining matplotlib with other packages does not involve tricks and hacks, just Python code. This is because there are numerous packages for Python for pretty much any task. For instance, to plot data stored in a database, you would use a database package to read the data and feed it to matplotlib. To generate a large batch of statistical graphics, you would use a scientific computing package such as SciPy and Python's I/O modules.

Thus, unlike many plotting packages, matplotlib is very orthogonal—it does plotting and only plotting. If you want to read inputs from a file or do some simple intermediary calculations, you will have to use Python modules and some glue code to make it happen. Fortunately, Python is a very popular language, easy to master and with a large user base. Little by little, we will demonstrate the power of this approach.

CONTINUE READING
83
Tech Concepts
36
Programming languages
73
Tech Tools
Icon Unlimited access to the largest independent learning library in tech of over 8,000 expert-authored tech books and videos.
Icon Innovative learning tools, including AI book assistants, code context explainers, and text-to-speech.
Icon 50+ new titles added per month and exclusive early access to books as they are being written.
matplotlib Plotting Cookbook
notes
bookmark Notes and Bookmarks search Search in title playlist Add to playlist font-size Font size

Change the font size

margin-width Margin width

Change margin width

day-mode Day/Sepia/Night Modes

Change background colour

Close icon Search
Country selected

Close icon Your notes and bookmarks

Confirmation

Modal Close icon
claim successful

Buy this book with your credits?

Modal Close icon
Are you sure you want to buy this book with one of your credits?
Close
YES, BUY

Submit Your Feedback

Modal Close icon
Modal Close icon
Modal Close icon