

Let's continue the statistical theme with something a little lighter: the Summary Table visualization, which is a simple tabular representation of statistical information. The configuration is straightforward. First, you need to select the columns in the data you want to report on; these will appear as rows in the table. Then you select from a comprehensive list of statistical measures you want to apply to those columns; these will appear as columns in the summary table. It's really a form of pivoting with a statistical focus.
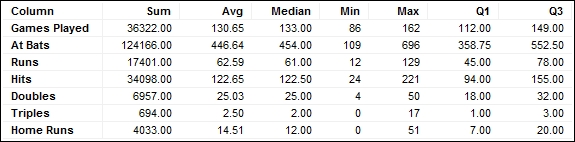
We'll use the baseball data as a convenient example. Load up the baseball data and add a summary table using the Insert menu or by clicking on the summary table icon in the icon tray. Select some columns and statistical measures. I selected the ones you can see in the screenshot. That's pretty much it. There are no coloring or formatting options. You can sort it if it makes sense.
The key thing to understand here...