Book Image

Practical Data Analysis Cookbook

By : Tomasz Drabas
Book Image

Practical Data Analysis Cookbook

By: Tomasz Drabas

Overview of this book

Data analysis is the process of systematically applying statistical and logical techniques to describe and illustrate, condense and recap, and evaluate data. Its importance has been most visible in the sector of information and communication technologies. It is an employee asset in almost all economy sectors. This book provides a rich set of independent recipes that dive into the world of data analytics and modeling using a variety of approaches, tools, and algorithms. You will learn the basics of data handling and modeling, and will build your skills gradually toward more advanced topics such as simulations, raw text processing, social interactions analysis, and more. First, you will learn some easy-to-follow practical techniques on how to read, write, clean, reformat, explore, and understand your data—arguably the most time-consuming (and the most important) tasks for any data scientist. In the second section, different independent recipes delve into intermediate topics such as classification, clustering, predicting, and more. With the help of these easy-to-follow recipes, you will also learn techniques that can easily be expanded to solve other real-life problems such as building recommendation engines or predictive models. In the third section, you will explore more advanced topics: from the field of graph theory through natural language processing, discrete choice modeling to simulations. You will also get to expand your knowledge on identifying fraud origin with the help of a graph, scrape Internet websites, and classify movies based on their reviews. By the end of this book, you will be able to efficiently use the vast array of tools that the Python environment has to offer.
Table of Contents (19 chapters)
Practical Data Analysis Cookbook
Credits
About the Author
Acknowledgments
About the Reviewers
www.PacktPub.com
Preface
Index

Removing duplicates


We can safely assume that all the data that lands on our desks is dirty (until proven otherwise). It is a good habit to check whether everything with our data is in order. The first thing I always check for is the duplication of rows.

Getting ready

To follow this recipe, you need to have OpenRefine and virtually any Internet browser installed on your computer.

We assume that you followed the previous recipes and your data is already loaded to OpenRefine and the data types are now representative of what the columns hold. No other prerequisites are required.

How to do it…

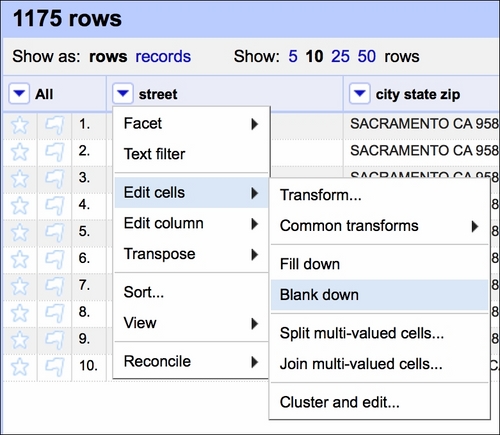
First, we assume that within the seven days of property sales, a row is a duplicate if the same address appears twice (or more) in the dataset. It is quite unlikely that the same house is sold twice (or more times) within such a short period of time. Therefore, first, we Blank down the observations if they repeat:

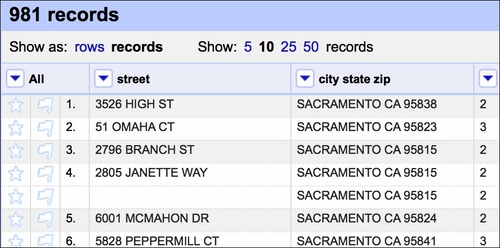
This effects in keeping only the first occurrence of a certain set of observations and blanking the rest (see the fourth row in the following screenshot):

Tip

The Fill down option has the opposite effect—it would fill in the blanks with the values from the row above unless the cell is not blank.

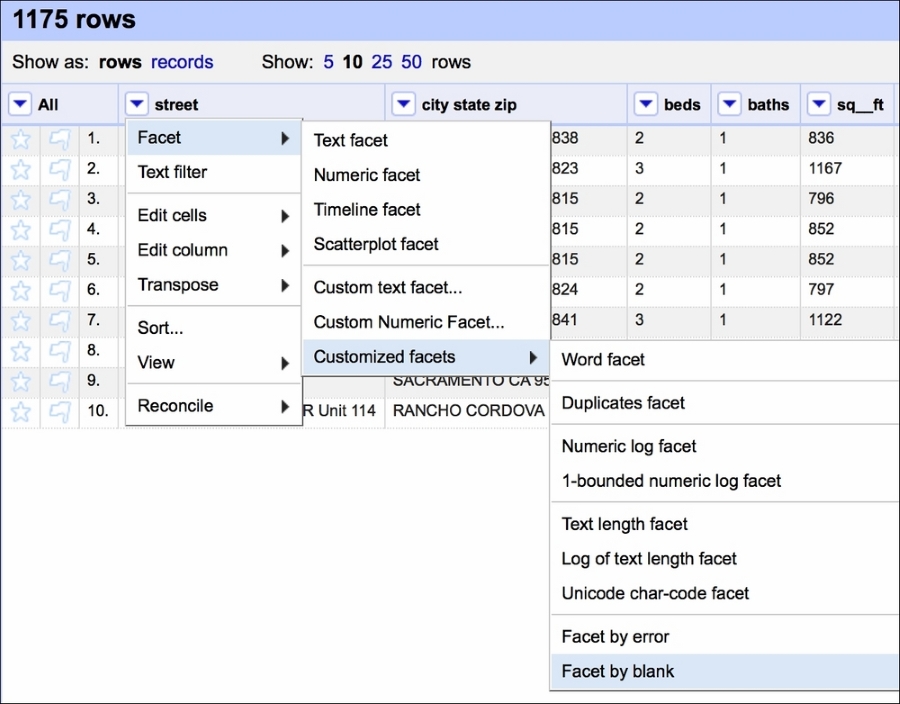
We can now create a Facet by blank that would allow us to quickly select the blanked rows:

Creating such a facet allows us to quickly select all the rows that are blank and remove them from the dataset:

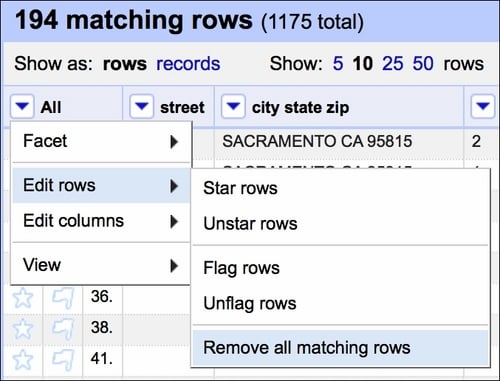
Our dataset now has no duplicate records.