Book Image

Python Data Analysis - Third Edition

By : Avinash Navlani, Ivan Idris
5 (1)
Book Image

Python Data Analysis - Third Edition

5 (1)
By: Avinash Navlani, Ivan Idris

Overview of this book

Data analysis enables you to generate value from small and big data by discovering new patterns and trends, and Python is one of the most popular tools for analyzing a wide variety of data. With this book, you’ll get up and running using Python for data analysis by exploring the different phases and methodologies used in data analysis and learning how to use modern libraries from the Python ecosystem to create efficient data pipelines. Starting with the essential statistical and data analysis fundamentals using Python, you’ll perform complex data analysis and modeling, data manipulation, data cleaning, and data visualization using easy-to-follow examples. You’ll then understand how to conduct time series analysis and signal processing using ARMA models. As you advance, you’ll get to grips with smart processing and data analytics using machine learning algorithms such as regression, classification, Principal Component Analysis (PCA), and clustering. In the concluding chapters, you’ll work on real-world examples to analyze textual and image data using natural language processing (NLP) and image analytics techniques, respectively. Finally, the book will demonstrate parallel computing using Dask. By the end of this data analysis book, you’ll be equipped with the skills you need to prepare data for analysis and create meaningful data visualizations for forecasting values from data.
Table of Contents (20 chapters)
1
Section 1: Foundation for Data Analysis
6
Section 2: Exploratory Data Analysis and Data Cleaning
11
Section 3: Deep Dive into Machine Learning
15
Section 4: NLP, Image Analytics, and Parallel Computing

Grouping and joining pandas DataFrame

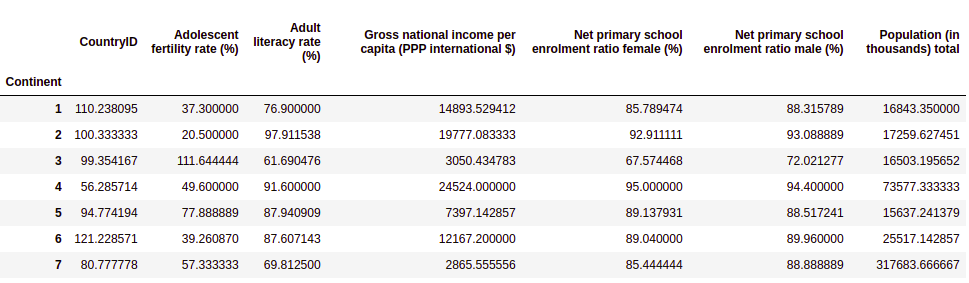
Grouping is a kind of data aggregation operation. The grouping term is taken from a relational database. Relational database software uses the group by keyword to group similar kinds of values in a column. We can apply aggregate functions on groups such as mean, min, max, count, and sum. The pandas DataFrame also offers similar kinds of capabilities. Grouping operations are based on the split-apply-combine strategy. It first divides data into groups and applies the aggregate operation, such as mean, min, max, count, and sum, on each group and combines results from each group:

# Group By DataFrame on the basis of Continent column
df.groupby('Continent').mean()

This results in the following output:

Let's now group the DataFrames based on literacy rates as well:

# Group By DataFrame on the basis of continent and select adult literacy rate(%)
df.groupby('Continent').mean()['Adult literacy rate (%)']

This results in the...