Book Image

Learning Tableau 2020 - Fourth Edition

By : Joshua N. Milligan
Book Image

Learning Tableau 2020 - Fourth Edition

By: Joshua N. Milligan

Overview of this book

Learning Tableau strengthens your command on Tableau fundamentals and builds on advanced topics. The book starts by taking you through foundational principles of Tableau. We then demonstrate various types of connections and how to work with metadata. We teach you to use a wide variety of visualizations to analyze and communicate the data, and introduce you to calculations and parameters. We then take an in-depth look at level of detail (LOD) expressions and use them to solve complex data challenges. Up next, we show table calculations, how to extend and alter default visualizations, build an interactive dashboard, and master the art of telling stories with data. This Tableau book will introduce you to visual statistical analytics capabilities, create different types of visualizations and dynamic dashboards for rich user experiences. We then move on to maps and geospatial visualization, and the new Data Model capabilities introduced in Tableau 2020.2. You will further use Tableau Prep’s ability to clean and structure data and share the stories contained in your data. By the end of this book, you will be proficient in implementing the powerful features of Tableau 2020 for decision-making.
Table of Contents (19 chapters)
9
Visual Analytics – Trends, Clustering, Distributions, and Forecasting
17
Other Books You May Enjoy
18
Index

Marimekko charts

A Marimekko chart (sometimes alternately called a Mekko chart) is similar to a vertically stacked bar chart, but additionally uses varying widths of bars to communicate additional information about the data. Here, for example, is a Marimekko chart showing the breakdown of sales by region and department.

The width of the bars communicates the total Sales for Region, while the height of each segment gives you the percentage of sales for the Department within the Region:

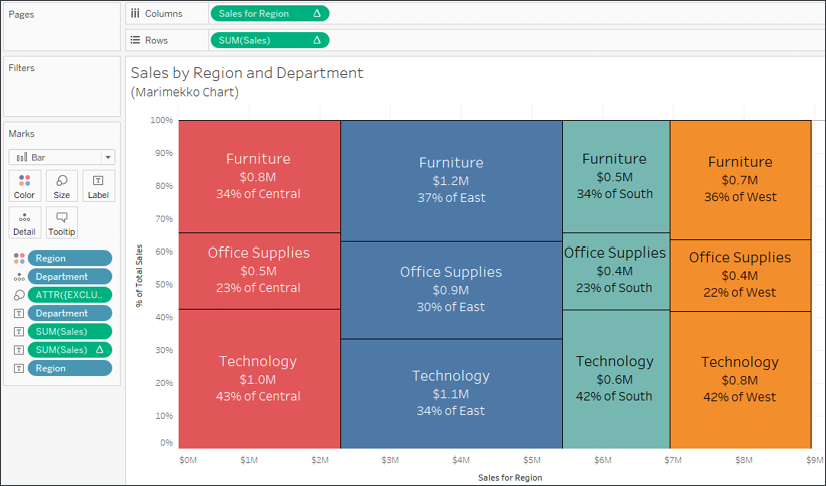
Figure 10.11: The amount of sales per Department is indicated by the height of each segment, while the width of each bar indicates the overall sales per Region

Creating Marimekko charts in Tableau leverages the ability to fix the width of bars according to the axis' units.

Clicking the Size shelf when a continuous (green) field is on Columns (thus defining a horizontal axis) and the mark type is set to Bar reveals options for a fixed size. You can manually enter...