-
Book Overview & Buying
-
Table Of Contents

Learning Tableau 2020 - Fourth Edition
By :
Learning Tableau 2020
By:
Overview of this book
Learning Tableau strengthens your command on Tableau fundamentals and builds on advanced topics.
The book starts by taking you through foundational principles of Tableau. We then demonstrate various types of connections and how to work with metadata. We teach you to use a wide variety of visualizations to analyze and communicate the data, and introduce you to calculations and parameters. We then take an in-depth look at level of detail (LOD) expressions and use them to solve complex data challenges. Up next, we show table calculations, how to extend and alter default visualizations, build an interactive dashboard, and master the art of telling stories with data.
This Tableau book will introduce you to visual statistical analytics capabilities, create different types of visualizations and dynamic dashboards for rich user experiences. We then move on to maps and geospatial visualization, and the new Data Model capabilities introduced in Tableau 2020.2. You will further use Tableau Prep’s ability to clean and structure data and share the stories contained in your data.
By the end of this book, you will be proficient in implementing the powerful features of Tableau 2020 for decision-making.
Table of Contents (19 chapters)
Preface

Taking Off with Tableau
 Free Chapter
Connecting to Data in Tableau
Moving Beyond Basic Visualizations
Starting an Adventure with Calculations and Parameters
Leveraging Level of Detail Calculations
Diving Deep with Table Calculations
Making Visualizations That Look Great and Work Well
Telling a Data Story with Dashboards
Visual Analytics – Trends, Clustering, Distributions, and Forecasting
Advanced Visualizations
Dynamic Dashboards
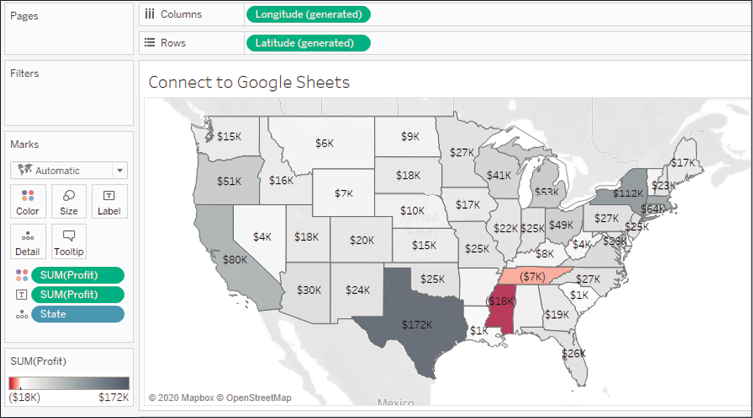
Exploring Mapping and Advanced Geospatial Features
Understanding the Tableau Data Model, Joins, and Blends
Structuring Messy Data to Work Well in Tableau
Taming Data with Tableau Prep
Sharing Your Data Story
Other Books You May Enjoy
Index