Book Image

Learning Tableau 2020 - Fourth Edition

By : Joshua N. Milligan
Book Image

Learning Tableau 2020 - Fourth Edition

By: Joshua N. Milligan

Overview of this book

Learning Tableau strengthens your command on Tableau fundamentals and builds on advanced topics. The book starts by taking you through foundational principles of Tableau. We then demonstrate various types of connections and how to work with metadata. We teach you to use a wide variety of visualizations to analyze and communicate the data, and introduce you to calculations and parameters. We then take an in-depth look at level of detail (LOD) expressions and use them to solve complex data challenges. Up next, we show table calculations, how to extend and alter default visualizations, build an interactive dashboard, and master the art of telling stories with data. This Tableau book will introduce you to visual statistical analytics capabilities, create different types of visualizations and dynamic dashboards for rich user experiences. We then move on to maps and geospatial visualization, and the new Data Model capabilities introduced in Tableau 2020.2. You will further use Tableau Prep’s ability to clean and structure data and share the stories contained in your data. By the end of this book, you will be proficient in implementing the powerful features of Tableau 2020 for decision-making.
Table of Contents (19 chapters)
9
Visual Analytics – Trends, Clustering, Distributions, and Forecasting
17
Other Books You May Enjoy
18
Index

Rendering maps with Tableau

Consider the following screenshot (the Basic Map example in the Chapter 12 workbook), with certain elements numbered for reference:

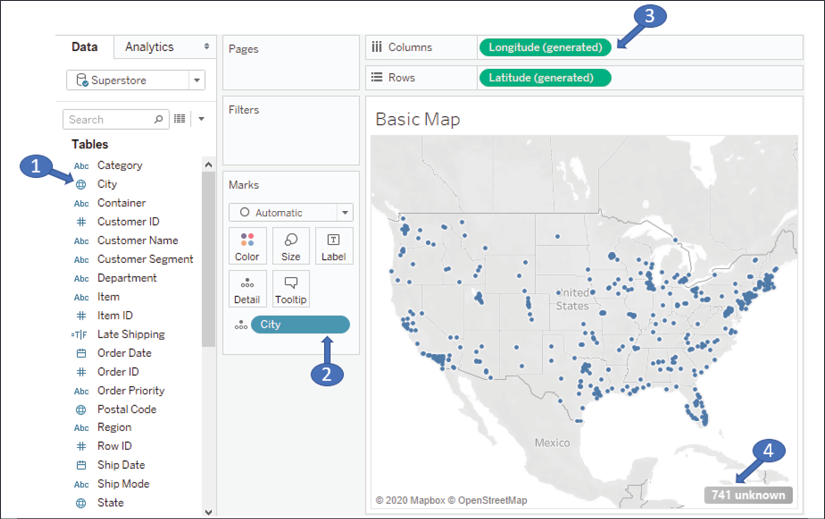
Figure 12.1: A basic geospatial rendering in Tableau

The numbers indicate some of the important aspects of Tableau's ability to render maps:

  1. A geographic field in the data is indicated with a globe icon. Fields that Tableau recognizes will have this icon by default. You may assign a geographic role to any field by using the menu and selecting Geographic Role.
  2. The geographic field in the view (in this case, on Detail) is required to render the map.
  3. If Tableau is able to match the geographic field with its internal database, the Latitude (generated) and Longitude (generated) fields placed on Rows and Columns along with the geographic field(s) on the Marks card will render a map.
  4. Values that are not matched with Tableau's geographic database will result in an indicator...