Book Image

Time Series Analysis on AWS

By : Michaël Hoarau
Book Image

Time Series Analysis on AWS

By: Michaël Hoarau

Overview of this book

Being a business analyst and data scientist, you have to use many algorithms and approaches to prepare, process, and build ML-based applications by leveraging time series data, but you face common problems, such as not knowing which algorithm to choose or how to combine and interpret them. Amazon Web Services (AWS) provides numerous services to help you build applications fueled by artificial intelligence (AI) capabilities. This book helps you get to grips with three AWS AI/ML-managed services to enable you to deliver your desired business outcomes. The book begins with Amazon Forecast, where you’ll discover how to use time series forecasting, leveraging sophisticated statistical and machine learning algorithms to deliver business outcomes accurately. You’ll then learn to use Amazon Lookout for Equipment to build multivariate time series anomaly detection models geared toward industrial equipment and understand how it provides valuable insights to reinforce teams focused on predictive maintenance and predictive quality use cases. In the last chapters, you’ll explore Amazon Lookout for Metrics, and automatically detect and diagnose outliers in your business and operational data. By the end of this AWS book, you’ll have understood how to use the three AWS AI services effectively to perform time series analysis.
Table of Contents (20 chapters)
1
Section 1: Analyzing Time Series and Delivering Highly Accurate Forecasts with Amazon Forecast
9
Section 2: Detecting Abnormal Behavior in Multivariate Time Series with Amazon Lookout for Equipment
15
Section 3: Detecting Anomalies in Business Metrics with Amazon Lookout for Metrics

Understanding common ingestion errors and workarounds

When ingesting data, Amazon Lookout for Equipment performs several checks that can result in a failed ingestion. When this happens, you can go back to your dataset dashboard and click on the View data source button. You will then access a list of all the ingestion jobs you performed.

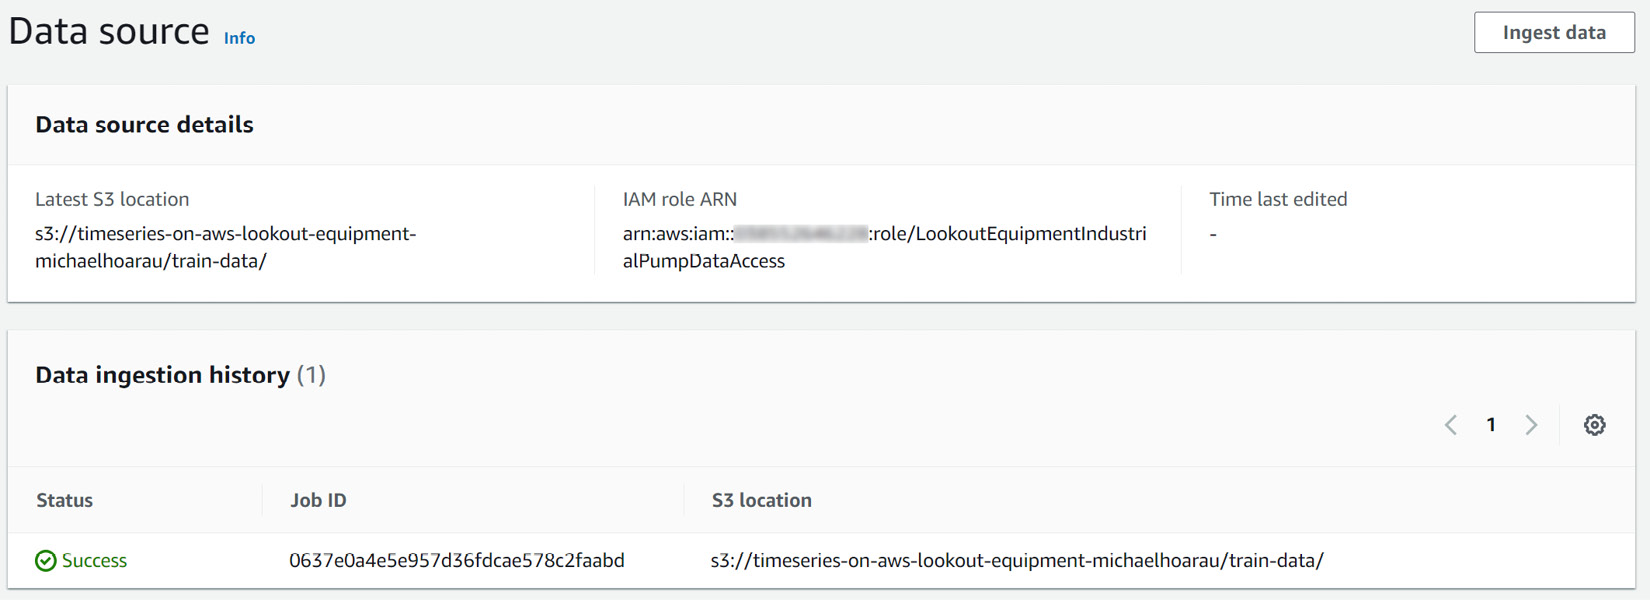
Figure 9.24 – Data ingestion history

This screen lists all the ingestion jobs you performed. When ingestion fails, the Success icon is replaced by a Failed one and you can hover your mouse on it to read about what happened. There are three main sources of errors linked to your dataset. Two of them can happen at ingestion time, while the last one will only be triggered when you train a model:

  • The S3 location where the time series data is not the right one.
  • The data file for a given tag/sensor is not found.
  • You have too many missing values in a given sensor.

Let's dive into each of these...