

Adding context to time series data
Simply speaking, there are three main ways an ML model can learn something new, as outlined here:
- Supervised learning (SL): Models are trained using input data and labels (or targets). The labels are provided as an instructor would provide directions to a student learning a new move. Training a model to approximate the relationship between input data and labels is a supervised approach.
- Unsupervised learning (UL): This approach is used when using ML to uncover and extract underlying relationships that may exist in a given dataset. In this case, we only operate on the input data and do not need to provide any labels or output data. We can, however, use labels to assess how good a given unsupervised model is at capturing reality.
- Reinforcement learning (RL): To train a model with RL, we build an environment that is able to send feedback to an agent. We then let the agent operate within this environment (using a set of actions) and react based on the feedback provided by the environment in response to each action. We do not have a fixed training dataset anymore, but an environment that sends an input sample (feedback) in reaction to an action from the agent.
Whether you are dealing with univariate, multiple, or multivariate time series datasets, you might need to provide extra context: location, unique identification (ID) number of a batch, components from the recipes used for a given batch, sequence of actions performed by a pilot during an aircraft flight test, and so on. The same sequence of values for univariate and multivariate time series could lead to a different interpretation in different contexts (for example, are we cruising or taking off; are we producing a batch of shampoo or shower gel?).
All this additional context can be provided in the form of labels, related time series, or metadata that will be used differently depending on the type of ML you leverage. Let's have a look at what these pieces of context can look like.
Labels
Labels can be used in SL settings where ML models are trained using input data (our time series dataset) and output data (the labels). In a supervised approach, training a model is the process of learning an approximation between the input data and the labels. Let's review a few examples of labels you can encounter along with your time series datasets, as follows:
- The National Aeronautics and Space Administration (NASA) has provided the community with a very widely used benchmark dataset that contains the remaining useful lifetime of a turbofan measured in cycles: each engine (identified by
unit_numberin the following table) has its health measured with multiple sensors, and readings are provided after each flight (or cycle). The multivariate dataset recorded for each engine can be labeled with the remaining useful lifetime (rul) known or estimated at the end of each cycle (this is the last column in the following table). Here, each individual timestamp is characterized by a label (the remaining lifetime measured in a cycle):

Figure 1.2 – NASA turbofan remaining useful lifetime
- The
ECG200dataset is another widely used time series dataset as a benchmark for time series classification. The electrical activity recorded during human heartbeats can be labeled as Normal or Ischemia (myocardial infarction), as illustrated in the following screenshot. Each time series as a whole is characterized by a label:

Figure 1.3 – Heartbeat activity for 100 patients (ECG200 dataset)
- Kaggle also offers a few time series datasets of interest. One of them contains sensor data from a water pump with known time ranges where the pump is broken and when it is being repaired. In the following case, labels are available as time ranges:

Figure 1.4 – Water pump sensor data showcasing healthy and broken time ranges
As you can see, labels can be used to characterize individual timestamps of a time series, portions of a time series, or even whole time series.
Related time series
Related time series are additional variables that evolve in parallel to the time series that is the target of your analysis. Let's have a look at a few examples, as follows:
- In the case of a manufacturing plant producing different batches of product, a critical signal to have is the unique batch ID that can be matched with the starting and ending timestamps of the time series data.
- The electricity consumption of multiple households from London can be matched with several pieces of weather data (temperature, wind speed, rainfall), as illustrated in the following screenshot:

Figure 1.5 – London household energy consumption versus outside temperature in the same period
- In the water pump dataset, the different sensors' data could be considered as related time series data for the pump health variable, which can either take a value of
0(healthy pump) or1(broken pump).
Metadata
When your dataset is multivariate or includes multiple time series, each of these can be associated with parameters that do not depend on time. Let's have a look at this in more detail here:
- In the example of a manufacturing plant mentioned before, each batch of products could be different, and the metadata associated with each batch ID could be the recipe used to manufacture this very batch.
- For London household energy consumption, each time series is associated with a household that could be further associated with its house size, the number of people, its type (house or flat), the construction time, the address, and so on. The following screenshot lists some of the metadata associated with a few households from this dataset: we can see, for instance, that
27households fall into theACORN-Acategory that has a house with2beds:
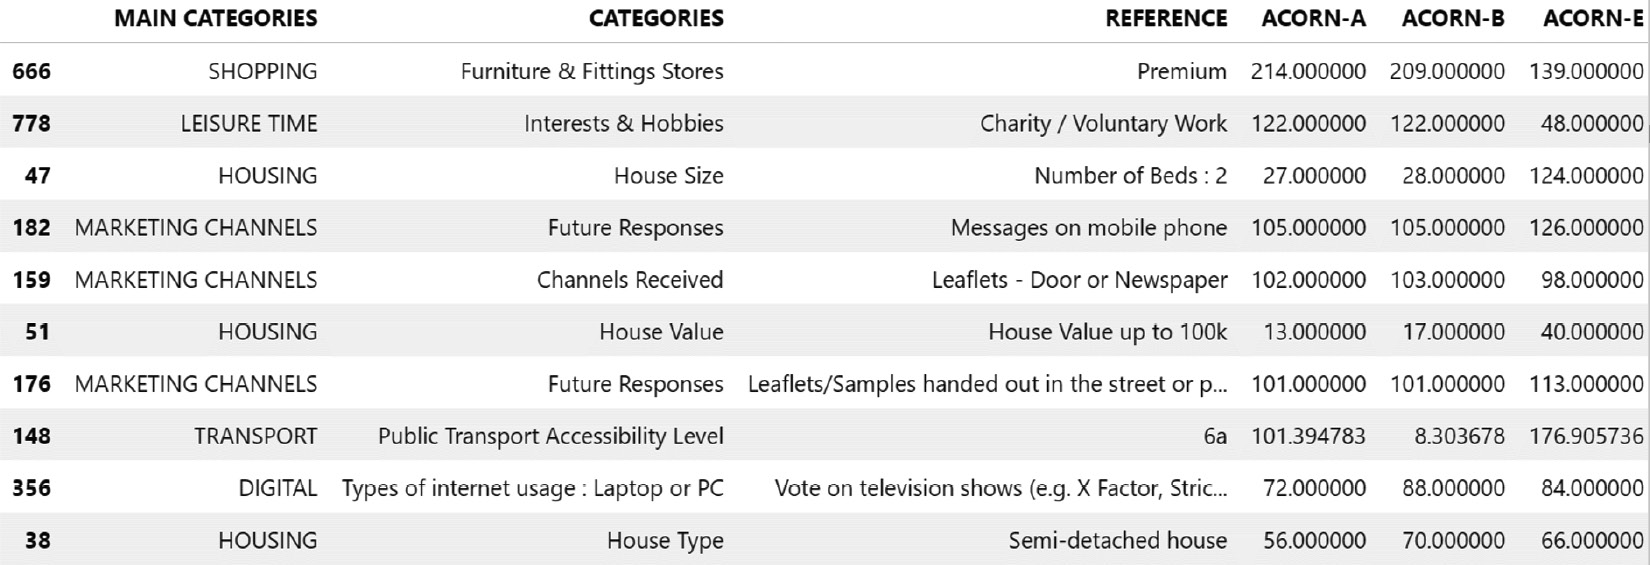
Figure 1.6 – London household metadata excerpt
Now you have understood how time series can be further described with additional context such as labels, related time series, and metadata, let's now dive into common challenges you can encounter when analyzing time series data.